- Title: The Earth transiting the Sun as seen from Jupiter’s moons: detection of an inverse Rossiter-McLaughlin effect produced by the Opposition Surge of the icy Europa.
- Authors: P. Molaro, M. Barbieri, L. Monaco, S. Zaggia, and C. Lovis
- First Author’s Institution: INAF-Osservatorio Astronomico di Trieste
How do you observe an Earth transit, from Earth? You look at reflected sunlight from large highly reflective surfaces. Good candidates include planets, and their moons. They are the largest mirrors in the solar system.
On Jan 5 2014 Earth transited the Sun, as seen from Jupiter and its moons. Jupiter itself is not a good sunlight reflector, due to its high rotational velocity and its turbulent atmosphere. Its major solid satellites are better mirrors. Therefore, the authors observed Jupiter’s moons Europa and Ganymede during the transit (see Figure 2), and took spectra of the Sun from the reflected sunlight with HARPS, and HARPS-N, two very precise radial velocity spectrographs. The former spectrograph is located in La Silla in Chile, and the latter in La Palma in the Canary Islands. The authors’ goal was to measure the Rossiter-McLaughlin effect.
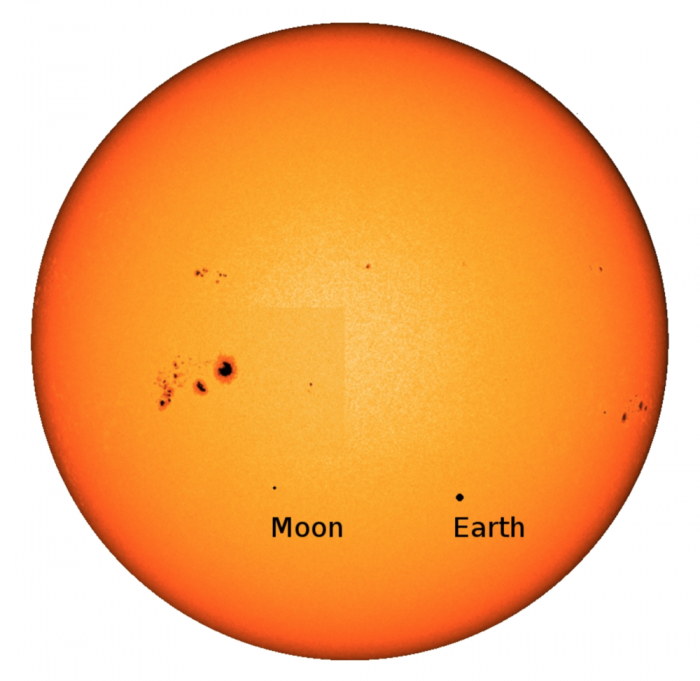
Fig 1: The Earth, and the Moon as they would appear to an observer on Jupiter on 5 January 2014, transiting the Sun. Figure 1 from the paper.
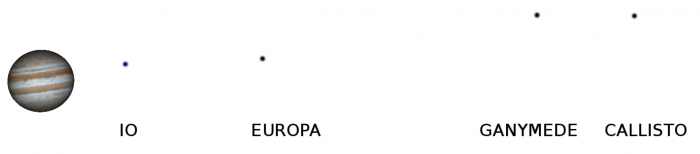
Fig 2: The geometric configuration of Jupiter and its moons, as seen from the Sun. Figure 2 from the paper.
Transits: sequential blocking of a star
The Rossiter-McLaughlin effect is a spectroscopic effect observed during transit events (see Figure 3). As a star rotates on its axis, half of the visible stellar photosphere moves towards the observer (blueshifted), while the other visible half the star moves away from the observer (redshifted). As a transiting object—in our case a planet—moves across the star, the planet will block out one quadrant of the star first, and then the other. This sequential blocking of blue-and redshifted regions on the star causes the observed stellar spectrum to vary. More specifically, the uneven contribution from the two stellar quadrants distorts the spectral line profiles, causing the apparent radial velocity of the star to change, when in fact it does not. The effect can give information on a) the planet radius, and b) the angle between the sky projections of the planet’s orbital axis, and the stellar rotational axis.

Fig 3: The Rossiter-McLaughlin effect: as a planet passes in front of a star it sequentially blocks blue-and redshifted regions of the star causing the star’s apparent radial velocity to change, when in fact it does not. The viewer is at the bottom. Figure from Wikipedia.
Observations of the transit
Figure 4 shows the whole set of corrected radial velocities taken of the transit, including observations of Jupiter’s moons the nights before and after. The transit, as seen from Jupiter’s moons, took about 9 hours and 40 minutes. The best available coverage of the event was for 6 hours from HARPS-N at La Palma Observatory. HARPS at La Silla Observatory was able to observe the transit for about an hour.
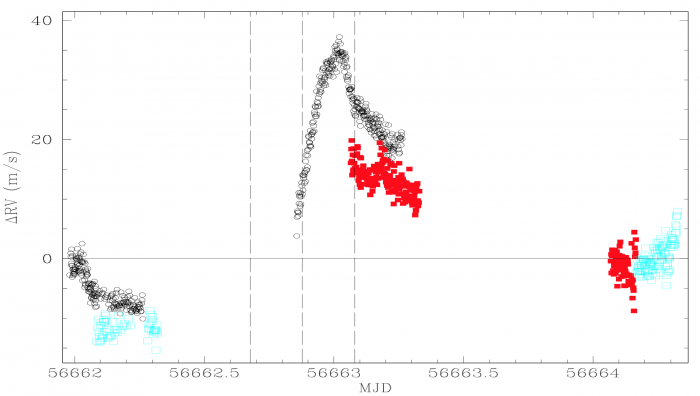
Fig 4: Corrected radial velocities measured on Jan 4-6, 2015. Vertical dashed lines denote the start, middle, and end of the transit. Observations of Europa from La Palma cover about 6 hours of the transit (black circles). Color observations are of Ganymede (cyan) and Europa (red) from La Silla. Figure 4 from the paper.
An anomalous drift
The expected modulation in the solar radial velocities due to the transit was on the order of 20cm/s. The Moon, which also partook in the transit (see Figure 1 again), added a few cm/s to this number.
Instead of detecting the expected 20cm/s modulation, the authors detected a much larger signal, on the order of -38m/s—a modulation about 400 times higher and opposite in sign than expected (see peak in Figure 4): an inverse Rossiter-McLaughlin effect.
The authors ruled out that the observed modulation could be caused by instrumental effects, as the two spectrographs showed consistent results. Additionally, the authors rule out the possible dependence of the anomalous signal with magnetic activity of the Sun, from observations conducted simultaneously with The Birmingham Solar Oscillation Network (BiSON). They had another idea.
The culprit: Europa’s opposition surge
The authors suggest that the anomaly is produced by Europa’s opposition surge.
The opposition surge is a brightening of a rocky celestial surface when it is observed at opposition. An example of an object at opposition is the full moon. The “surge” part has to do with the increase, or “surge”, in reflected solar radiation observed at opposition. This is due to a combination of two effects. First, at opposition the reflective surface has almost no shadows. Second, at opposition photons can constructively interfere with dust particles close to the reflective surface, increasing its reflectivity. The latter effect is called coherent backscatter.
The authors created a simple model for Europa’s opposition surge, and compared it to their observations (see Figure 5). It works. As the Earth moves across the face of the Sun, rather than blocking the light (like in the Rossiter-McLaughlin effect shown in Figure 3), the net effect is that the light grazing the Earth is amplified. The Earth thus acts as a lens, compensating not only for the lost light during the eclipse—but makes the Sun appear much brighter! This explains the opposite sign, and the amplitude of the effect. Additionally, the amplification of reflected light is not fixed only to the transit, but happens gradually as Earth gets closer to transiting, and as Europa gets closer to being at opposition. The effect is symmetric, and is analogously observed as Earth moves out of transit.
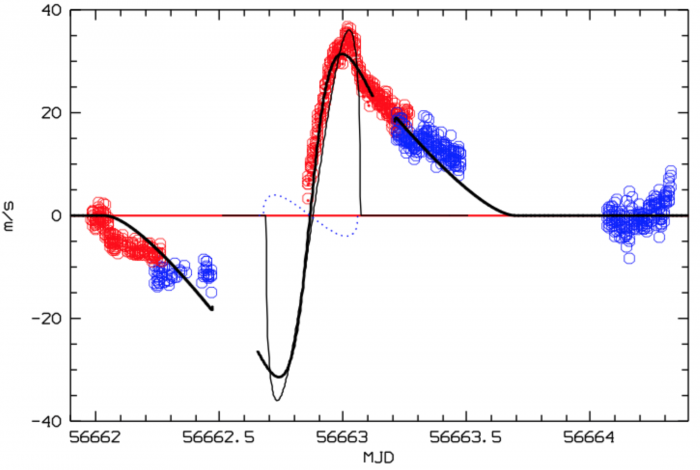
Fig 5: The model of the opposition surge (thick black line) compared to observations from HARPS-N at La Palma (red), and HARPS at La Silla (blue). The dotted blue line shows the originally expected Rossiter-McLaughlin effect, amplified 50-fold for visibility. It is much smaller than the observed signal. Figure 7 from the paper.
Conclusion
This is the first time an inverse Rossiter-McLaughlin effect, caused by a moon’s opposition surge, has been detected. The authors predict the effect can be observed again during the next conjunction of Earth and Jupiter in 2016. Although, this will be a grazing transit with a smaller amplitude than the transit studied in this paper, the authors can now predict with confidence the extent of the newly discovered effect in the upcoming event.
Author
Trackbacks/Pingbacks