- Title: ESPRESSO: The next European exoplanet hunter
- Authors: F. Pepe et al.
- First Author’s Institution: Geneva Observatory, University of Geneva
Behind every research instrument, there is a drive to answer a scientific question. Are you on the lookout to see if there are habitable planets out there? Or do you want to see how or if physical ‘constants’ have varied with time? In the authors’ view, why not design a versatile instrument capable of tackling a wealth of outstanding questions in astronomy: a sort of a “scientific Pandora’s box” for extremely high precision astronomical research? This is where ESPRESSO comes in, a high resolution spectrograph to be installed at the Very-Large Telescope (VLT), where the acronym loosely stands for: Echelle SPectrograph for Rocky Exoplanets and Stable Spectroscopic Observations.
Scientific drivers
As the name certainly suggests the instrument is largely intended for the search of rocky exoplanets, but the authors stress that it will be great for other things too, and mention in particular the study of the variability of fundamental physical constants.
Finding and characterizing rocky planets in the habitable zones of their parent stars has been discussed widely in Astrobites before. ESPRESSO will use the radial velocity method: just as a star gravitationally tugs an orbiting planet, the planet tugs the host star causing the star to move in its own tiny orbit. This kind of stellar ‘wobble’ can then be detected as tiny shifts in the star’s spectra. ESPRESSO sets out to improve the radial velocity precision (goal: 10cm/s) of the very successful HARPS instrument (precision: 1m/s), which has found numerous exoplanets using the same technique. Just to put things in perspective, the Earth exerts a 9cm/s wobble on the Sun.
The figure below plots planets that have available radial-velocity data orbiting solar-type stars (open circles). Using the radial-velocity method we have an inherent bias toward finding low-star-mass-high-planet-mass systems, as these systems tend to increase the observed radial-velocity signal. ESPRESSO’s radial-velocity precision allows us to detect planets with masses ranging down to Earth-mass that orbit solar and lighter-mass stars (see figure). By digging deeper into this new mass domain, we hope to get a better view of the planet-mass distribution, and gain a better understanding of how planets form in planetary-systems.
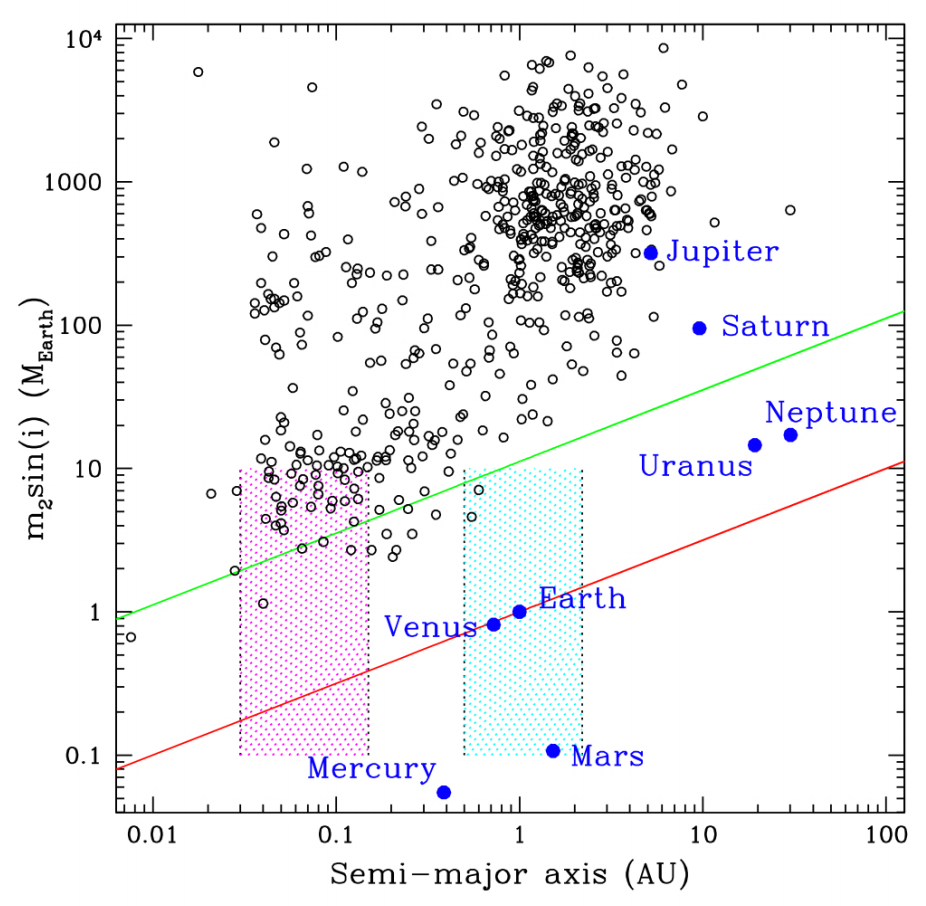
Figure 1: Detectability of planets orbiting a 0.8 solar-mass (M☉) star (red line), and a 1 M☉ star (green line) as calculated for ESPRESSO: planets above the colored solid lines are detectable; planets below are not. The habitable zones of stars that are 0.8-1.2 M☉, and 0.2-0.3M☉ are indicated with the blue and pink areas, respectively. Figure 2 from the paper.
Astronomy offers us ways to probe the variability of various physical constants with very large distances, and thus also with time. Observations of spectral lines in distant quasars have shown evidence for a dipole like variation across the sky in the fine structure constant α – the coupling strength between photons and charged particles (see figure below). Why this is variation is observed is still an open question – is it just systematics? A high-statistical confirmation of variability is here of great importance to successfully rule out systematics – and a high resolution spectrograph that combines a large collecting area with extreme wavelength precision, is the perfect tool for this purpose.

Figure 2: An all-sky spatial dipole showing a dipole-like variation across the sky in the fine structure constant α. Larger symbols denote larger deviations. Is this result just systematics? – Next generation instruments will help us know! Figure 3 from the paper.
Description of the instrument
ESPRESSO is described as a fibre-fed, cross dispersed, echelle high resolution optical spectrograph. Let’s break this sentence down to see what the more technical terms mean:
-
Fiber-fed: A set of optical fibers are used to feed the light to the instrument. ESPRESSO receives three types of signals: 1) a signal of the astrophysical target (the star itself); 2) a calibration signal – a signal with known reference wavelengths; and lastly 3) a dark-sky or background signal – this is needed to correct for background light which pollutes signal 1 which we are interested in.
-
Cross dispersed, echelle: A cross-disperser and an echelle grating are both optical elements which dictate how the instrument will disperse the light to get the spectra. You can think of them as fancy gratings that output spectra in a flat 2-dimensional grid – perfect to be imaged by a CCD detector!
-
High resolution optical spectrograph: ESPRESSO will work in the 380nm-780nm optical wavelength range, with a high spectral resolving power, and will be able to achieve a resolution up to R~200.000.
Several clever design-tricks have been used to achieve the highest resolution possible while keeping the size of the optics at a minimum, as big delicate optics tend to cost a lot more than smaller ones. For example, the instrument uses a dichroic beam splitter to split the light into a blue and red arm (see figure below), which allows each arm to be optimized separately for image quality and efficiency.
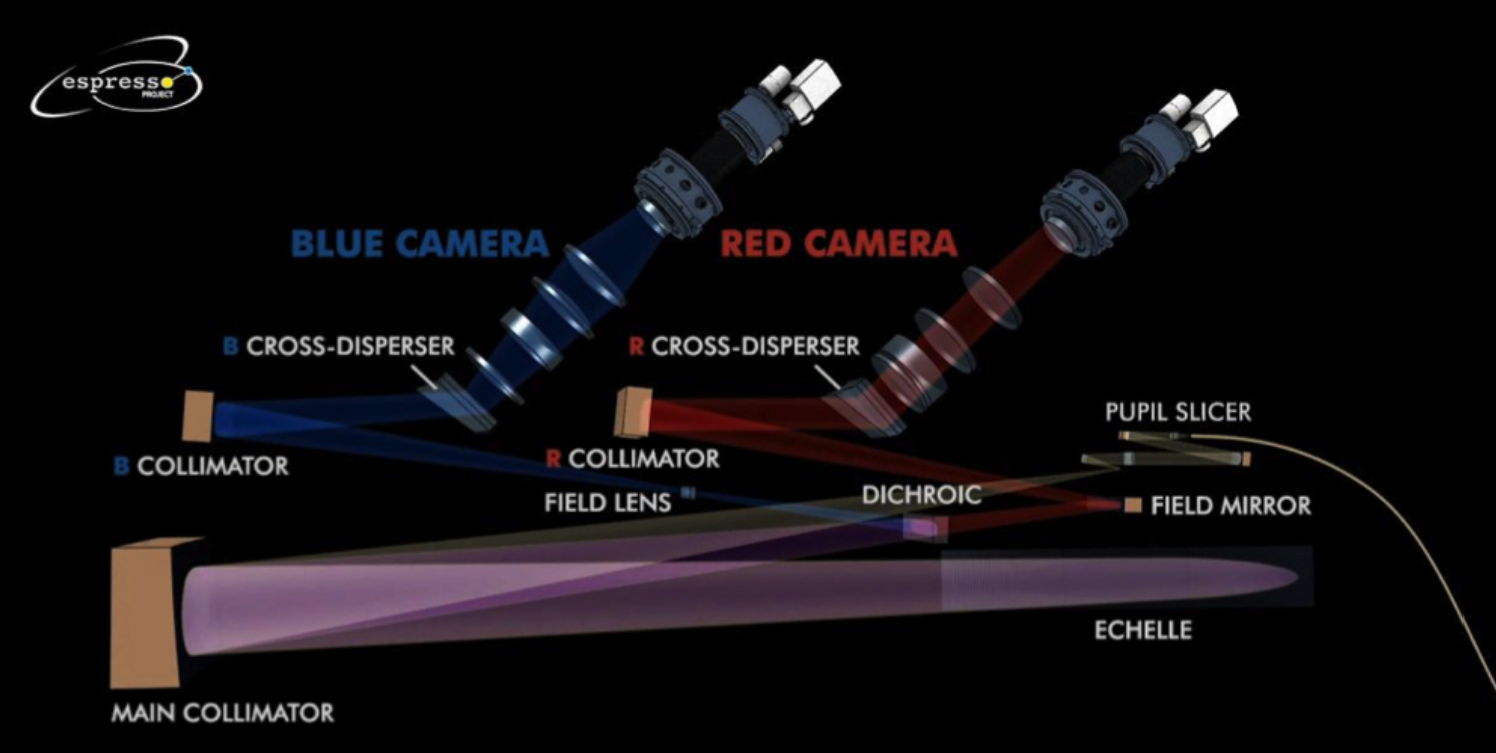
Figure 3: The optical layout of ESPRESSO, which splits the optical path into a red-arm, and a blue-arm, which can be optimized separately. Figure 6 from the paper.
Interestingly, ESPRESSO’s 10cm/s radial velocity precision translates to be able to detect a spectral line shift of 2nm on the CCD detector plane. This is just a few silicon atoms across – a fraction of a pixel! The optics are, therefore, mounted in a specifically designed optical bench to meet a strict set of thermo-mechanical tolerances. To minimize temperature variations the spectrograph will be located in a multi-shell active thermal enclosure system (see figure below). Each additional shell will improve the temperature stability by a factor of 10, which allows the optical bench of the instrument – which will be under vacuum – to get down to 0.001K temperature stability.
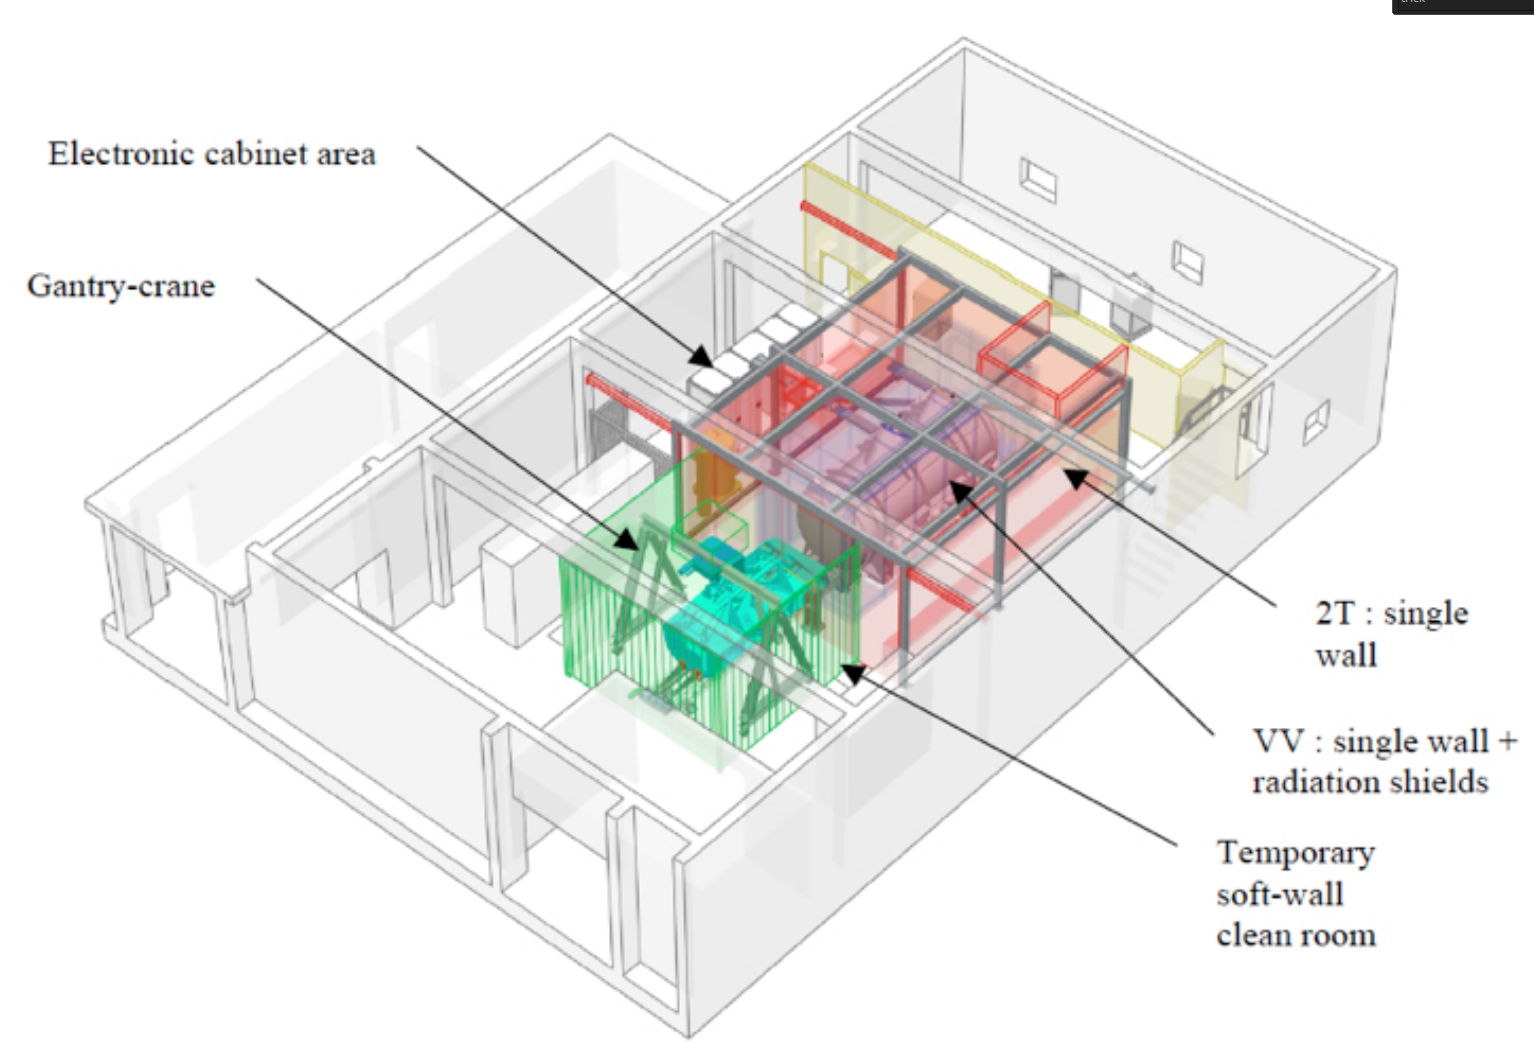
Figure 4: Sketch of ESPRESSO’s multi-shell temperature control system: each successive layer further minimizes any kind of temperature variations. Figure 15 from the paper.
Conclusion
ESPRESSO will be installed at Paranal Observatory in 2016 with first start of operations planned later that year. Its design makes use of technical heritage from “The Radial-Velocity Industry Standard” HARPS instrument, but the new extreme precision requirements – and the option for operating using light from the 4 Unit Telescopes of the VLT, simultaneously – all call for many innovative design solutions.
An ample set of ideas are provided in the paper of what science ESPRESSO – an instrument that combines unprecedented radial-velocity precision in the optical with one of the largest telescopes available – can potentially do and what exciting questions it may possibly answer. But in the end, who can really anticipate all the breakthroughs a new piece of technology will offer? Let’s wait and see.
Author
Trackbacks/Pingbacks