Title: Using Ice and Dust Lines to Constrain the Surface Densities of Protoplanetary Disks
Authors: Diana Powell, Ruth Murray-Clay, Hilke Schlichting
First Author’s Institution: University of California, Santa Cruz
Status: Accepted to ApJ [open access]
The clock is ticking. Time is running out. If you placed a disk with 10 times the mass of Jupiter around a star that was very much like the Sun, how quickly could you build a gas giant planet? Would you have enough gaseous material to form a planet of that size? Or would the disk fade away before you had time to finish assembling your magnificent planetary masterpiece?
Astronomers studying exoplanets (including me) would understand a lot more about the amount of material and time needed to form these planets if we had precise measurements of the masses of protoplanetary disks. Unfortunately, we cannot just measure the amount of H2 or He gas – the two largest components in the disk – from their spectral lines since these elements do not emit any spectral lines under normal disk conditions. As an alternative, our only option for measuring the mass of a disk is to measure the mass of one of the much smaller components – either the CO gas (using specific spectral lines), or the dust (see below) – and then extrapolate that to the total disk mass.
However, these two methods often produce different results, with the dust-based method typically giving disk masses that are up to 10 times higher than the CO-based method. In today’s paper, Diana Powell et al. seek to resolve this disparity by introducing an entirely new approach for measuring the mass of a protoplanetary disk.
How to Measure a Disk’s Mass from the Dust Flux
Normally, the dust is used to measure the mass of a disk with the following method:
- [Step 1] Measure the flux from the star and the disk at a given wavelength. If we choose a wavelength in the infrared, the contribution from the star will be negligible and the entire flux is from the dust in the disk.
- [Step 2] Convert the flux into the dust mass. (The dust mass is proportional to the dust flux.)
- [Step 3] Multiply the dust mass by the gas-to-dust ratio. We expect this ratio to be the same as in the space between our solar system and others (the interstellar medium, or ISM), where it has already been measured to be 100-to-1.
However, this method will not work if the disk does not have the same gas-to-dust ratio as the ISM. To get a more accurate idea of the disk’s total mass, we need a more direct probe of the amount of gas in the disk.
Back to the Dust: A More Direct Method
Diana Powell et al., the authors of today’s paper, argue that the dust may be a much more direct tracker of the gas in the disk than the above method makes it seem – provided that we look at how the dust is distributed, instead of just the total amount.
In 2014, ALMA took the first high resolution images of a protoplanetary disk, giving us the potential to use a disk’s structure to determine its mass. One hidden attribute of these disk images is that the size of the disk changes at different wavelengths. For example, the size of the disk around TW Hydrae is 130 AU when observing at about λ = 1 micron, but just 25 AU when observing at λ = 10 mm (see Figure 1). Powell et al. believe these size “discrepancies” are the key to connecting the dust distribution to the gas.
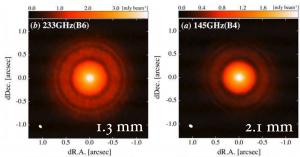
Figure 1. ALMA images of disk around TW Hydrae at λ = 1.3 mm (left) and λ = 2.1 mm (right). At λ = 1.3 mm (observing ~1.3 mm particles), TW Hydrae appears to have a radius of about 1 arcsec (54 AU) compared to just 0.8 arcsec (43 AU) at λ = 2.1 mm (when observing ~2.1 mm particles). This difference increases for wavelengths that are further apart.
Competition Between Drift and Growth Leaves Dust Lines Behind
It is not surprising that protoplanetary disks appear to be smaller at larger wavelengths. Since each wavelength is only sensitive to dust particles that are near the same size as the wavelength itself, these different wavelength observations simply show that the smallest dust particles in the disk extend much farther out than the larger ones.
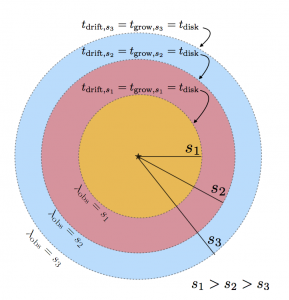
Figure 2. Schematic of the method. Take an image at 3 wavelengths. Recognize each image probes particle sizes (s1, s2, s3) equal to each wavelength. Mark the outer edge of the disk at that wavelength (the “dust line,” denoted with a dashed circle). At each of these locations, use the equality of the three timescales (see next section) to calculate the surface density at that distance from the star. Fig. 2 from the paper.
We expect that type of behavior to occur from the way dust particles interact with a mostly gaseous disk. At larger distances from a star, dust particles drift inwards much faster than they can grow (see the brown region of Figure 1 in this post). As a result, the smallest dust particles do not have time to grow to the sizes that they do in the inner disk. This leaves behind a series of “dust lines” that reflect the upper size limit that particles can reach at any given distance from the star (see Figure 2). These “dust lines” are close in for larger particles, and farther out for smaller ones.
Besides the slowness of growth shaping the dust distribution, the age of a stellar system also limits the maximum particle size. Since larger dust particles drift inwards much faster than smaller ones, older disks should also run out of these larger particles at large distances.
The Three Timescales
Mathematically, the roles that drift, growth, and the age of the system each play in limiting dust particle sizes correspond to setting these three timescales equal to each other. Powell et al. then take advantage of the dependence of these timescales on particle size, the gas surface density, and the gas-to-dust ratio to determine the gas and dust surface densities at any given distance from the star – just from knowing the maximum particle size at that distance.
In practice, we will only have measurements at several select wavelengths (particle sizes), which may or may not correspond to the distances we would like to have. However, if these wavelengths span a large enough range, this method should not only determine the total mass of a disk, but also constrain the surface density profile across a wide range of the outer disk!
Does this method work?
The authors test out their method on the disk around TW Hydrae and find that their measured gas and dust surface densities agree with previous measurements from the “dust flux” method, but not the CO-based method. They hope that as ALMA collects more high resolution images of protoplanetary disks, they will be able to further test this method. If it is successful, it will greatly add to what we know about the conditions needed for planets to form.
Featured Image Credits: Catch Me If You Can, Disk Detective, Powell et al. 2017 (today’s paper), and Ansdell et al. 2016.
Author