Title: Illuminating Dark Matter Halo Density Profiles Without Subhaloes
Authors: Catherine E. Fielder, Yao-Yuan Mao, Andrew R. Zentner, Jeffrey A. Newman, Hao-Yi Wu, Risa Wechsler
First Author’s Institution: Department of Physics and Astronomy, University of Pittsburgh, Pittsburgh, PA 15260, USA
Status: Submitted to MNRAS
The History of a Halo
Each of the galaxies inhabiting our universe lives in the center of a halo of dark matter. What that means is that a whole lot of matter we can see (including planets, stars, globular clusters, and light bulbs) all globbed together to make up a galaxy is surrounded by a whole lot of stuff we can’t see, called dark matter (DM). Despite its invisibility, the dark matter produces a gravitational pull both on other dark matter and “normal” matter. Consequently, the shape and structure of the dark matter in the galaxy’s halo are incredibly important to understand; they tell us not just how the halo interacts gravitationally, but also give us clues on how the galaxy got there in the first place.
In fact, the dark matter halo forms first—there happens to be a little more dark matter in this particular corner of the universe, so it decides to get the band together and form a halo. Because there’s so much mass present, the halo is extremely gravitationally attractive, and it ends up bringing in a bunch of “normal” matter into the center of its gravitational potential well, where a galaxy forms. If this were the only thing to ever happen to a halo, most of them would look the same (except for a difference in total mass). Instead, we live in a much more interesting universe, where galaxy haloes are constantly going bump in the night and merging with other haloes to create one bigger halo. This can happen in several iterations, creating truly massive haloes with a bunch of subhaloes floating around inside (see Figure 1). This is called hierarchical halo formation, and it makes for some interesting halo shapes.
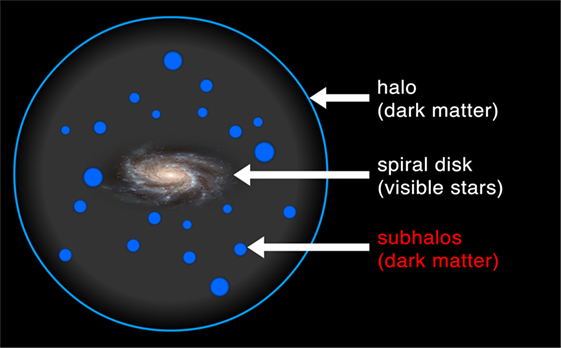
Figure 1. A sketch of a spiral galaxy in the center of its host halo, with several subhaloes around it. Note that the picture is not to scale — the halo is actually many times bigger than the galaxy! Image source: https://kids.frontiersin.org/.
Separating out the Subhaloes
Because massive haloes tend to have a few subhaloes gravitationally bound to them, observational studies treat the central halo and subhaloes as connected but separate entities, each with their own potential well. A counterpart to observational studies are simulations of dark matter: a bunch of massive (but visible to us!) DM particles are put in a box and allowed to interact for some time, allowing astrophysicists to watch a halo being formed and draw conclusions. In these simulations, researchers tend to include all the mass into one, total halo, thus making them hard to compare directly to observed data. The authors of today’s paper try to bridge that gap by removing subhaloes from existing simulation datasets, calculating the profiles of just the central, host halo, and comparing them with common halo profile models.
The authors use a set of simulations called the Milky Way Mass Zoom-In (MMMZ), and another called the RHAPSODY simulations. The main difference between the two sets is that the MMMZ simulations include haloes that are about as massive as the Milky Way halo, while the RHAPSODY simulations include haloes that are more than 100 times more massive. This range of halo masses allows the authors to test the consistency of their findings, as well as letting them test for mass dependence of the subhalo-less profiles.
In order to separate the subhaloes from the central halo, the authors use a halo-finding algorithm called Rockstar. Essentially, the algorithm looks for particles inside the edge of the full halo that are gravitationally bound together as well as being bound to the larger halo, and marks them as a subhalo. The authors then subtract the identified subhaloes from the full halo, and spherically average to find the density profile of just the central halo. Even after all the subhaloes are subtracted, the central halo doesn’t have a completely smooth profile, as you can see in Figure 2.
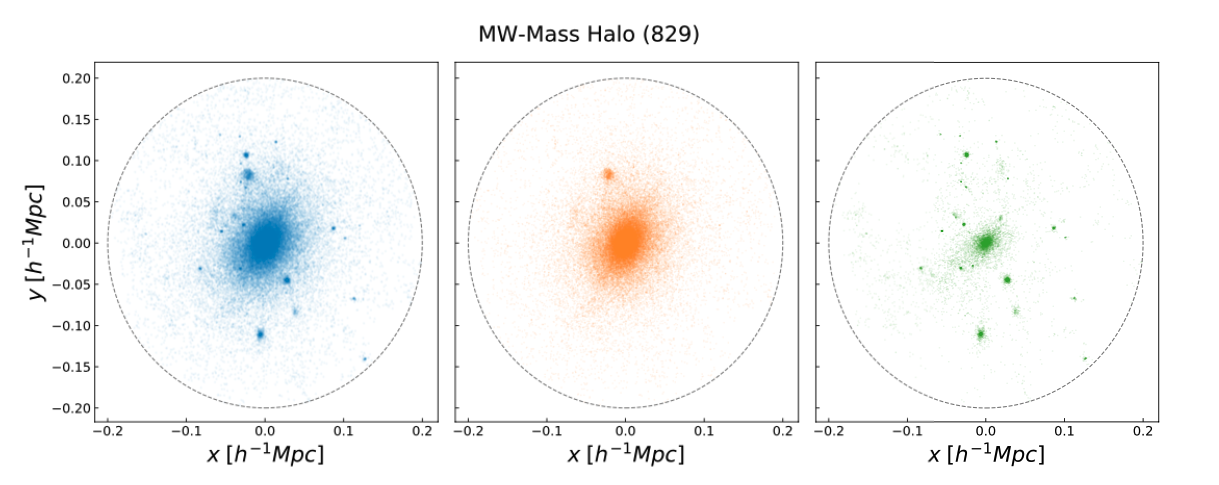
Figure 2: This figure depicts a visualization of how the subhalo removal works. The three panels above are 2D-projections in one of the MMMZ haloes, with the edge of the halo (called the virial radius) shown with the dashed circle. On the left, all of the dark matter particles making up the halo are shown in blue. On the right, subhaloes identified by a halo-finding algorithm called Rockstar are shown in green. In the middle, the central halo is visible in orange, with some additional structure that was not identified as a subhalo. By definition, adding the middle (orange) and right (green) panels we recover the leftmost (blue) panel with all the particles. Figure 1 in the original paper.
Halo Profiles Without Subhaloes
Once they have excluded the subhaloes and averaged over the central haloes’ profiles, the authors try fitting them with some of the more popular models. One of the most popular is called the Navarro-Frenk-White (NFW) profile, which essentially states that the density of a halo falls as \(1/r\) close to the center of the halo and as \(1/r^3\). Another popular one is the Einasto profile, which uses an astronomer’s favorite formula: the power-law. In this case, however, we’re talking about an exponential of a power-law: the Einasto profile says that the density of a halo falls off with distance as \(\exp \left(-A r^{\alpha}\right)\), where A is some parameter we can fit and \(\alpha\) is the power-law index. Both of these profiles come with “generalized” counterparts, which essentially just include more free parameters for fitting, thus making the profiles more malleable.
In both the more and less massive simulation runs, the authors find that the difference between the profiles of central haloes with and without subhaloes is most visible at large scales, towards the edge of the haloes (see Figure 3). This makes sense, since the outer edges of the host halo is where subhaloes tend to live. The authors also find that, subhaloes or no, the best fits to a halo model they achieve is with the generalized version of the Einasto profile. They also show their fits are much worse with the NFW profile — arguably the most popular model thus far!
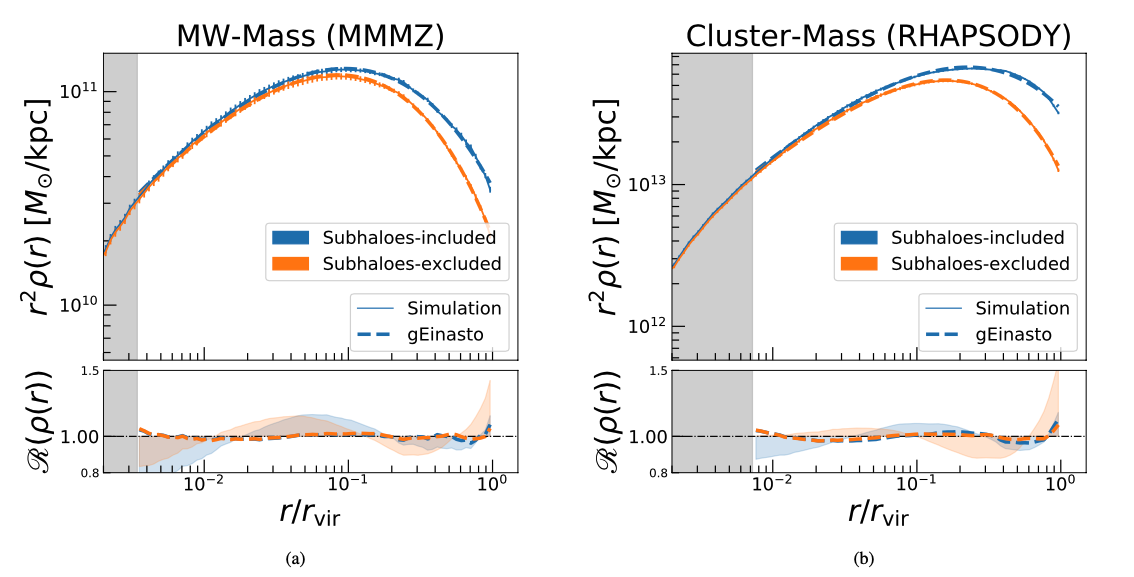
Figure 3. The authors computed the average profile over all the runs in each set of simulations, and are showing them here. On the left of all the panels, the grey areas show scales that are below the resolution of the simulation. In the top panel of (a), we can see the average profile of all the MMMZ runs, both with subhaloes (blue) and without subhaloes (orange). The densities on the vertical axis are multiplied by a distance squared, which essentially shows us how much mass is inside a given distance r. In the top panel of (b), we see the same thing, except with the more massive haloes of the RHAPSODY simulation. In both cases, the two profiles diverge in the outer parts of the halo (as r gets close to the edge of the halo, or the virial radius), which is where the subhaloes tend to be located. Both panels also show a fit of the so-called generalized Einasto profile to the average profile, which is dashed. In the bottom panels, the authors are showing us the ratio of the calculated density profile to the generalized Einasto fits, again shown with the dashed lines. Note that the ratio is very close to 1, which means its a pretty good fit. The authors also showed the ratio of a different popular profile model (called an NFW profile) to the data in the lighter blue and orange bands. Because these bands are farther from a value of 1.0 than the dashed data, we can see that the generalized Einasto profile is a much better guess in these cases than the NFW profile. Figure 4 in the original paper.
What’s in a Model?
So the best fit the authors achieve is when using a generalized Einasto profile — but how good of a fit is it, anyway? Since the form of the profile is an exponential of a power-law, what we are really interested in is what that power is. To get at it, the authors take a natural log of the density (to get rid of the exponential) and then the derivative of the log. This makes the power-law index (\(\alpha\) in the previous section) pop out. Since the power-law index is a function of radius (it’s different in the inner halo and the outer halo!), the authors plot it against distance (see Figure 4). Like before, the calculated power index from the data and the predicted power index from the generalized Einasto fit agree very well in the inner regions; however, they start to diverge towards the edge of the halo. Since the profiles of haloes without subhaloes are smoother, they are better described by idealized halo models, and the generalized Einasto profile fits the profiles without subhaloes slightly better than those with subhaloes included.
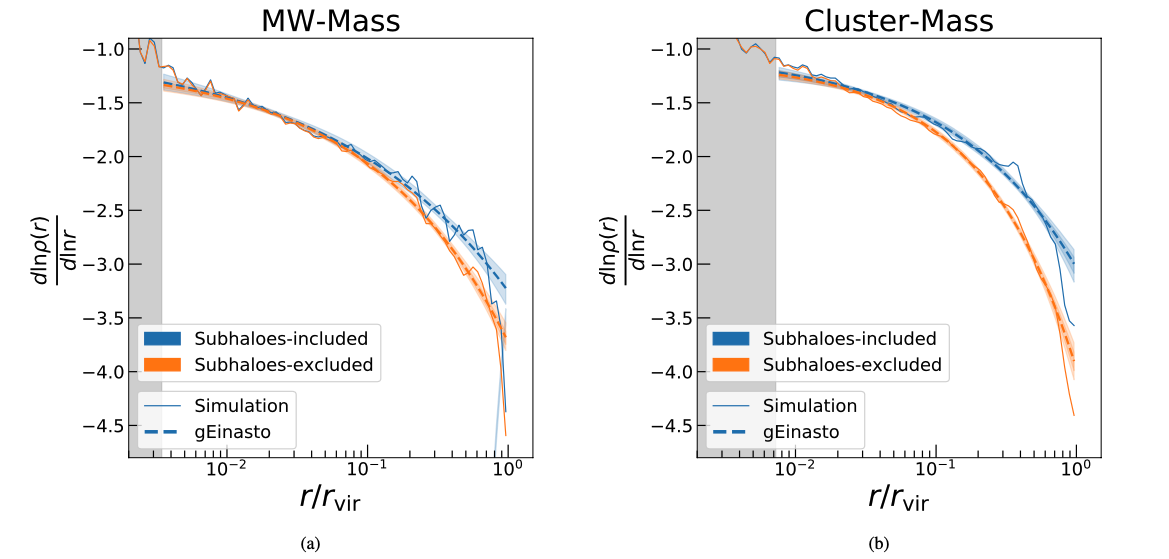
Figure 4. Both panels are showing the index of the power-law describing the density profile as a function of radius. On the left (a), the authors show the calculated power-law from the averaged MMMZ haloes with the thin, continuous lines. On the right (b), the authors show the same for the higher mass, RHAPSODY haloes. In both panels, the orange line describes the case where subhaloes are excluded, and the blue line shows the case where they are included. The orange and blue dashed lines show the best generalized Einasto profile fit to each of these cases, and the shaded regions behind them show the 95% confidence interval. As before, the cases with and without subhaloes differ at large distances (close to the edge of the halo). The calculated power-law and generalized Einasto fit also start to diverge slightly at larger distances. However, in both the Milky Way mass and larger mass halo cases the fit is better in the case of a halo profile without subhaloes, which is smoother, and thus more likely to be well fit with an idealized halo model. Figure 5 in the original paper.
Summary & Conclusion
Two of the main takeaways the authors outline in their paper is that 1) the density profiles of the central halo without subhaloes falls of more quickly at large radii than density profiles containing subhaloes, and 2) the generalized Einasto profile, though less popular than other models, is the best fit to their haloes, both with and without subhaloes. Both of these findings could be important to folks studying the nature of the nearly universal halo profiles (particularly when the halos are formed), as well as for people interested in how mergers impact other halo parameters. Together, all these studies reveal to us snapshots in the life of your average dark matter halo—including the one currently hosting us somewhere near its center.
Author