Title: Stellar splashback: the edge of the intracluster light
Authors: Alis J Deason, Kyle A Oman, Azadeh Fattahi, Matthieu Schaller, Mathilde Jauzac, Yuanyuan Zhang, Mireia Montes, Yannick M Bahé, Claudio Dalla Vecchia, Scott T Kay, Tilly A Evans.
First Author’s Institution: Institute for Computational Cosmology, Department of Physics, University of Durham, Durham, UK
Status: Published in MNRAS [closed access]
Sizing up a cluster
According to our current favoured cosmological model, ΛCDM, galaxies are born and evolve in dark matter halos (see this astrobite for more information on halos). These halos and the galaxies that inhabit them can grow through mergers, an example of hierarchical structure formation which is a key prediction of ΛCDM. Some of the largest halos that have formed by the present day are host to galaxy clusters, which are made up of hundreds to thousands of individual galaxies, all in orbit within the same halo. Quantifying the size of a galaxy cluster by defining an edge that marks where its dark matter halo ends is a complex task. Due to this complexity, there are many different methods used in the astronomy literature that all attempt to define the edge of a halo.
One relatively new halo boundary definition, termed the splashback radius, marks the transition point between matter that is falling into a halo, and matter that is already orbiting within the halo. The splashback radius is a physically well-motivated way of defining a halo’s size, and can be detected in simulations by analysis of the density profile of dark matter. While the splashback radius can be calculated directly in simulations, where information about the dark matter is easily accessible, these definitions pose an observational challenge. We cannot directly observe dark matter, so ideally there would exist a link between the dark matter and the visible matter in a halo, so that both simulators and observers can calculate halo sizes in a consistent manner.
Today’s authors go searching for such a link by using the Cluster-EAGLE (C-EAGLE) simulation suite to study both the dark matter distribution of galaxy clusters, and the stars that are stripped from galaxies falling into these clusters, with the ultimate goal of trying to define the edge of a galaxy cluster.
Remnants of galaxy destruction
Unfortunately for galaxies that are falling into a galaxy cluster, the journey to become a member of a cluster is a messy one. Forces that arise due to differences in the gravitational force exerted on the infalling galaxy from the cluster prove dangerous for the smaller galaxy, and are known to be responsible for removing stars via tidal stripping (see this astrobite for more on tidal features). These stripped stars are deposited around the cluster’s halo, forming what is known as the intracluster light (ICL). The remnants of infalling galaxies leave an observational trace of the destruction caused by a galaxy cluster, and since tidal stripping can begin at large distances from the cluster centre, the ICL provides a potential way to observationally probe the outskirts of galaxy clusters.
The authors of today’s paper begin by investigating whether they can detect the splashback radius in simulated galaxy clusters, and whether they can find a similar edge in the stellar component (the ICL) of their clusters. The C-EAGLE simulation suite contains 30 simulated galaxy clusters, where the dark matter, gas and stars have been simulated from initial conditions.
Signs of splashback
The splashback radius is easily detectable in simulations as it tends to manifest itself as a sharp dip in the logarithmic slope profiles of the dark matter density (this feature is often referred to as a ‘caustic’). Physically, this is due to the fact that there is expected to be a change in the density of dark matter around the splashback radius. The splashback radius is identified and indicated by the vertical black lines in Figure 1.
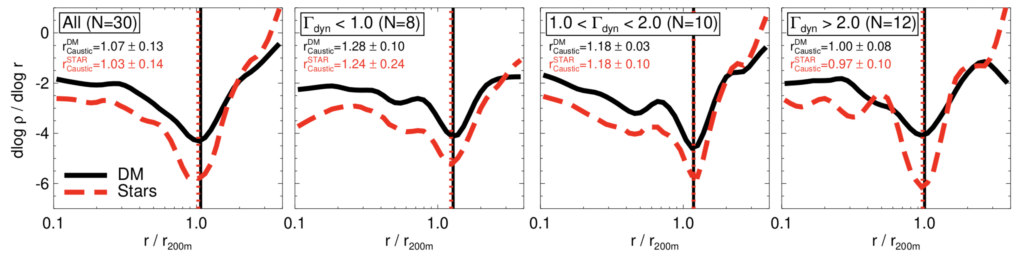
Figure 1: The stacked logarithmic slope profiles of the dark matter (solid black) and stellar (dashed red) density profiles of the clusters. A sharp upturn is seen at the same point in both the dark matter and stellar components, corresponding to the splashback radius. The left panel shows the angular median of all 30 clusters, while the remaining middle-left, middle-right, and right panels are subset by low, medium, and high mass accretion rates (Γ) respectively. Figure 4 in paper.
The leftmost panel of Figure 1 displays the stacked logarithmic slope profiles of both the dark matter (black solid line) and ICL (red dashed line) for all 30 clusters in the C-EAGLE simulation. The remaining panels show the same information, but are broken down by clusters with low (Γ<1), medium (1<Γ<2) and high (Γ>2) mass accretion rates. Not only is it clear from these plots that a sharp feature is detectable in both the dark matter and stellar component, but it can also be seen that they occur at the same radius — the splashback radius — for both the stars and dark matter! It seems that the ICL is tracing the underlying dark matter distribution, providing us with a link between observable matter and dark matter.
We can also see from the three rightmost panels that a trend exists between the location of the splashback radii and the mass accretion rate of the halo (i.e. how quickly a halo is growing). Slowly growing halos tend to have the splashback radii occurring at higher values of r relative to halos that are accreting matter at a faster rate. This indicates that measurements of the splashback radius can also provide details on how a halo assembles over time.
The implications of these results are really exciting: if we can observationally measure the splashback radius of a galaxy cluster from the ICL, we can potentially learn a lot about the underlying dark matter distribution of the cluster, and even something about how fast it is accreting mass. However, given the low surface brightness nature of the ICL, it is not a given that the stellar component will be detectable in the real Universe.
So, can we measure it?
Not yet… but the authors predict we will be able to soon!!
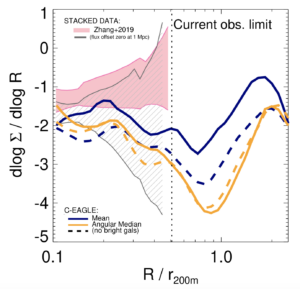
Figure 2: The logarithmic slope profiles of the projected stellar density profiles for the C-EAGLE clusters and observational data. The blue and orange lines use different methods for stacking the simulated cluster data (mean and angular median respectively). The pink and grey lines are derived from stacked observations of galaxy clusters from the Dark Energy Survey, utilising different zero flux offsets. Adapted from Figure 9 in paper.
Figure 2 shows a comparison between the logarithmic slope profiles of the projected stellar density profiles of observations and simulations of stacked clusters. Pink and grey lines show observations, derived from the 300 galaxy clusters in the Dark Energy Survey (DES) Year 1 data, and the simulated C-EAGLE galaxies are shown in blue and orange (each colour represents a different method of converting to the projected 2-dimensional density profile, necessary for comparing to observations). The main takeaway from this plot is that the splashback radius occurs beyond the current observational limit, and detecting stellar splashback will require probing to larger projected distances than is currently feasible.
Today’s authors have shown that while measurements of the splashback radius in galaxy clusters are beyond current observational limits, new facilities suited to studies of low surface brightness systems, such as the Vera C. Rubin Observatory, the Nancy Grace Roman Space Telescope, and Euclid will be able to probe out to the distances necessary to make measurements of the stellar splashback radius achievable. This ultimately means that in the future, there will be a way to make independent measurements of the size of galaxy clusters by using the ICL, which will also provide us with information on the growth rate of galaxy clusters. Perhaps a small consolation for the poor, destroyed galaxies that the ICL stars were cruelly taken from…
Astrobite edited by Lili Alderson
Featured image credit: ESA/Hubble & NASA, RELICS
Author