Title: The Cen A galaxy group: dynamical mass and missing baryons
Authors: Oliver Müller, Frederico Lelli, Benoit Famaey, Marcel S. Pawlowski, Katja Fahrion, Marina Rejkuba, Michael Hilker, Helmut Jerjen
First Author’s Institution: Institute of Physics, Laboratory of Astrophysics, École Polytechnique Fédéale de Lausanne (EPFL), 1290 Sauverny, Switzerland
Status: preprint on arXiv; submitted to Astronomy & Astrophysics (A&A)
Placeholder text
Placeholder text
A significant fraction of galaxies at present day – about 50% – reside in groups or clusters, while the rest are scattered in isolation and make up the so-called “field galaxies”. This is especially true in the Local Volume, which has a rich diversity of galaxy populations, including a number of groups. The primary difference between “groups” and “clusters” of galaxies lies in their numbers and total masses – groups often consist of about 10-50 galaxies and have a total mass of \(10^{12} – 10^{13} M_{\odot}\), while clusters are a lot more massive and can have many hundreds of galaxies, with the most massive clusters weighing in at \(\sim 10^{15} M_{\odot}\). Such high-mass clusters are rare, however, and smaller groups of galaxies are a lot more common at present day.
Placeholder text
Cosmic weighing scales
There are two primary techniques to measure the masses of large, high-mass galaxy clusters. The first relies on gravitational lensing, the phenomenon where light rays are deflected from their original path due to the presence of mass. Roughly speaking, more massive objects tend to deflect light rays more, causing stronger distortions in the images of background objects produced, providing a reasonable estimate of the mass of the “lens” object (in this case, a galaxy cluster). Alternatively, astronomers rely on the observation of X-rays emitted by extremely hot and ionised gas in galaxy clusters to measure their masses, since these X-ray observations allow us to estimate the overall gravitational effect of the cluster on the gas.
Unfortunately, neither of these techniques works well for smaller galaxy groups. They don’t have as much hot gas and X-ray emission as larger clusters, and their lower mass makes gravitational lensing less prominent as well. Hence, their masses are usually measured via dynamical modelling – studying the motion of objects orbiting in and around a group and using our understanding of gravity to infer its mass. One caveat, however, is that a number of galaxy groups in the Local Volume show planar configurations (that is, a massive central “host” galaxy with smaller satellite galaxies orbiting in more or less a coherent plane around it), including our own Milky Way and its satellites. This phenomenon, dubbed the “satellite plane problem”, is not yet fully understood and makes dynamical modelling of such systems tricky because they no longer have spherical symmetry – see astrobites here and here for more on satellite planes.
Placeholder text
First, a Bayesian approach and dynamical modelling
The authors of today’s paper explore a Bayesian approach to study the Centaurus A galaxy group (hereafter called “Cen A”), and show that it has significant planarity while also attempting to estimate its mass via dynamical modelling of galaxy orbits. They used data for 27 of the confirmed satellite galaxies of Cen A that have both measured distances and line-of-sight (LOS) velocities. Figure 1 shows the LOS velocities of galaxies in Cen A compared to their distribution from the centre of the group.
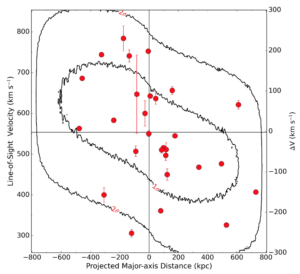
Figure 1: LOS velocities of galaxies in the Cen A group relative to their distribution from the group’s centre. Red points show individual galaxies, with the error bars highlighting the error on LOS velocity measurements.The inner and outer contours show the 68% and 95% probabilities of finding a galaxy at that position on this diagram, based on their best-fit dynamical model. (Source: Figure 2 in today’s paper.)
Placeholder text
The dynamical mass of Cen A
Once you have the average circular velocity of a system, inferring its dynamical mass becomes relatively straightforward. The authors used a combination of the theory of Newtonian gravity and the Virial Theorem to get a relation between the circular velocity and the total dynamical mass of the group, as shown in the equation below.
\(\Large{M_{dyn} (<R) = \frac{R v_{circ}^2}{G}}\)
This gave them a mass estimate of \(5.3 \pm 3.5 \times 10^{12} M_{\odot}\) within a radius of \(350 kpc\) from the centre of Cen A, and \(12.4 \pm 5.5 \times 10^{12} M_{\odot}\) within \(800 kpc\). It is important to note that this kind of dynamical mass measurement provides the total mass of a system (consisting of stars, gas, and dark matter, with dark matter dominating the mass budget in galaxy groups), since all the various components would contribute to the overall gravitational potential of Cen A.
The authors then go one step further and attempt to compute the baryonic mass of Cen A (the mass of stars and gas in the system, not including dark matter). Previous studies of the group had shown that the gas mass in Cen A was not that significant, so stars dominate the baryonic mass budget. They estimate the baryonic mass of the group (by adding up the stellar masses of the various galaxies) to be approximately \(2 \times 10^{11} M_{\odot}\), resulting in a baryon fraction (baryonic mass divided by total mass) of \(\sim 0.035\).
Figure 2 shows the position of Cen A on a plot of baryonic mass versus \(v_{circ}\) (known as the Baryonic Tully-Fisher Relation). They compare their values for the Cen A group to those for individual galaxies from different catalogs, and find that Cen A agrees extremely well with the trend for individual galaxies! Given that galaxy groups and galaxies have different mass scales and potentially somewhat different formation and evolution mechanisms, the authors note that they were expecting more of a difference, and that this agreement is quite striking.
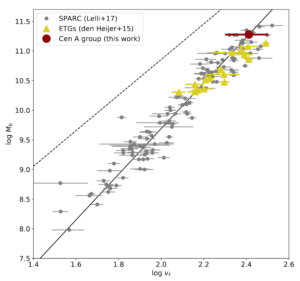
Figure 2: Baryonic Tully-Fisher Relation, with baryonic mass on the y-axis and circular velocity on the x-axis. The red point shows the results for the Cen A galaxy group from today’s paper, and the other points as well as best-fit lines show trends for individual galaxies from various surveys. (Source: Figure 3 in today’s paper.)
Placeholder
Finally, the authors note that the baryon fraction of \(\sim 0.035\) they measure for Cen A is well below the cosmic baryon fraction of \(0.157\) measured from large-scale cosmological studies. This indicates that the Cen A group has far fewer baryons for its dark matter content, compared to the Universe on average. This is a result that has also been seen in other groups and other studies, and is called the “missing baryons problem” (see this bite for more). Although one such dynamical mass measurement for one specific system won’t help us find a solution to this cosmic problem overnight, this is an exciting paper nonetheless! Today’s authors demonstrate the usefulness of their Bayesian approach to dynamical modelling for galaxy groups, and provide a new constraint on the mass of one of the groups in our neighbourhood, Centaurus A.
Astrobite edited by Lili Alderson
Featured image credit:
Author