Grab your umbrellas, ’cause it’s raining grazing planets!

Title: Accurate modeling of grazing transits using umbrella sampling

Authors: G. J. Gilbert

First Author’s Institution: Department of Astronomy and Astrophysics, University of Chicago, Chicago, Illinois

Status: Accepted for publication in AJ, pre-print available on the arxiv

Today’s author is using umbrellas to accurately model the planets that “graze” their stellar hosts.

Planets that Graze on their Stars

Roughly 75% of all known exoplanets were discovered via transit surveys. These are surveys that monitor the brightnesses of many stars at once, looking for dips in these brightnesses. These dips could be caused by a planet passing, or “transiting,” in front of the star. Although rare, some of these planets only “graze” their host stars, meaning that they only partially transit their parent star’s disk (check out this astrobite to learn more about a specific case of a grazing planet).

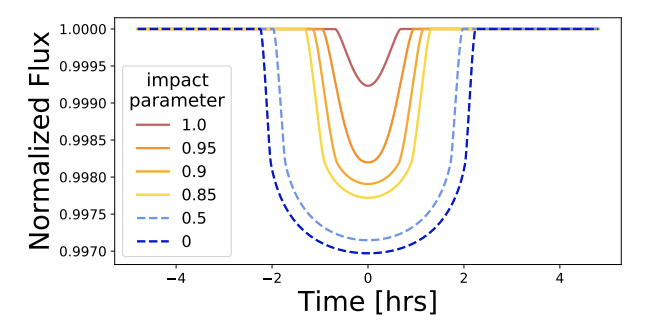
In astronomical terms, “grazing” planets are defined as those that have an impact parameter that is larger than the ratio of the planet’s radius to the star’s radius. The impact parameter is defined as the distance between the center of the stellar disk and the center of the planetary disk at conjunction, where conjunction is the point in a planet’s orbit where it is most closely aligned with its star, as viewed from Earth. An impact parameter of 0 is a case of a perfectly-centered transit, and an impact parameter of 1 is a case where only half of the planetary disk transits in front of the stellar disk.

Figure 1 demonstrates how the shape of the light curve from a transiting planet changes as a function of impact parameter. The depth of the dip in a light curve allows astronomers to estimate the planet’s radius relative to the star, but if the planet is grazing, then this estimation becomes more difficult. For example, the light curve of a smaller, non-grazing planet could look the same as the light curve from a larger, grazing planet. One therefore needs to simulate grazing transits even in cases where it is unlikely that the planet grazes its host star.

A plot showing normalized flux versus time in hours for various impact parameters from 0 to 1. The lightcurve dips to 0.9970 and lasts for four hours for an impact parameter of 1. The lightcurve only dips to 0.995 and lasts for maybe an hour for an impact parameter of 0.
Figure 1. The impact parameter (the distance between the centers of the stellar and planetary disks at conjunction) changes the shape of a transiting planet’s light curve. On this plot, the flux, or brightness, of the star normalized to 1 is on the y-axis. The time before and after the transit in hours is on the x-axis. Planets that have a high impact parameter graze the disk of their host star during their transit, making it more difficult to characterize a planet using its light curve. (Figure 2 in the paper)

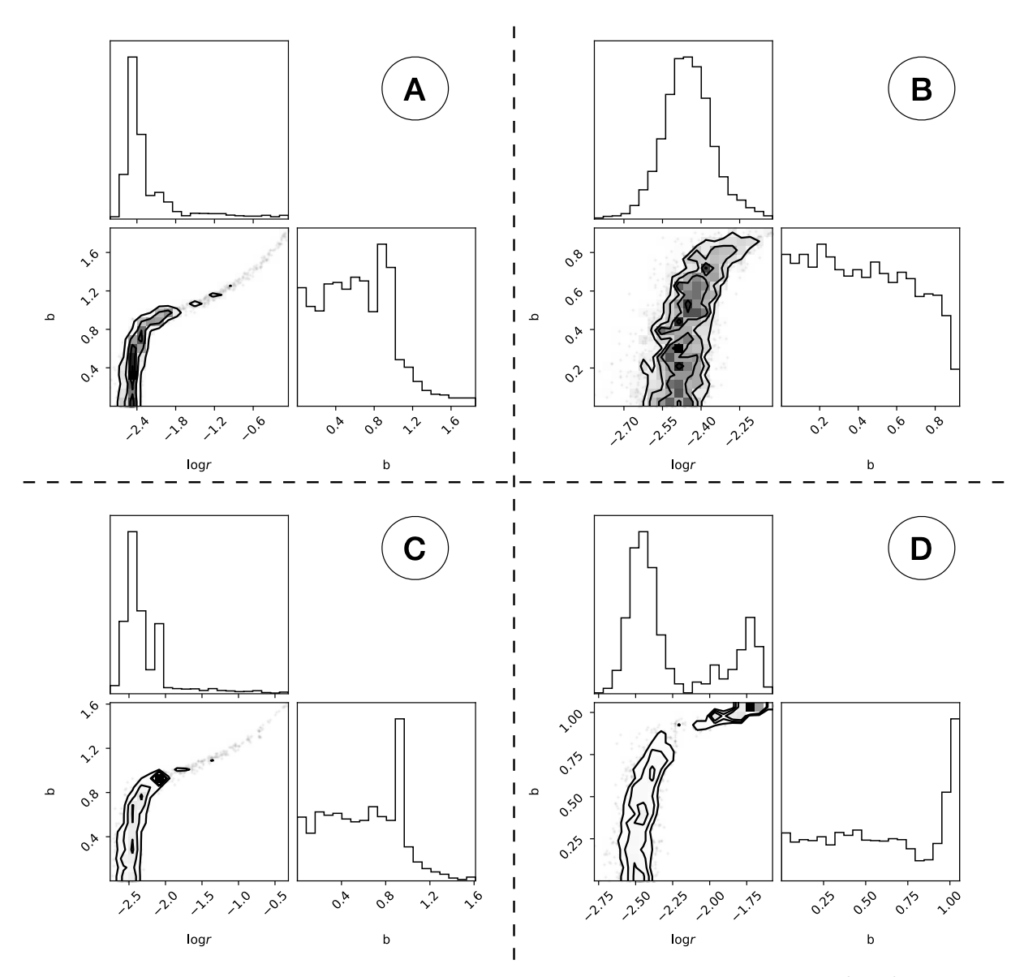
However, today’s author shows that standard Monte Carlo methods, which are frequently used by exoplanet scientists to model grazing planets, can lead to unreliable results! Identical runs of the same model can return differing results, or results where it is not obvious that the model is wrong (Figure 2)! When dealing with a handful of planets, one can let the simulation run for a longer period of time, or add additional data, such as the spectrum of the star, to the model. However, for larger samples, a more efficient method is needed. So what can astronomers do instead?

Four corner plots, marked A, B, C, and D, showing various posterior distributions from four Monte Carlo Simulations. The corner plots are trying to converge on values for impact parameter and log(radius).
Figure 2. Plots of the posterior distributions from four identical Monte Carlo simulations. Although the simulations are identical at the start, they devolve into four wildly different scenarios. In Panel A, the simulation is mostly consistent with a non-grazing planet. In Panel B, the simulation fails to explore entirely whether the planet is grazing or not. In Panel C, the simulation catches at the boundary between a grazing and non-grazing planet. In Panel D, the simulation has a bimodal posterior distribution that barely explores whether the planet is grazing at all. (Figure 6 in the paper)

Umbrella-ella-ella

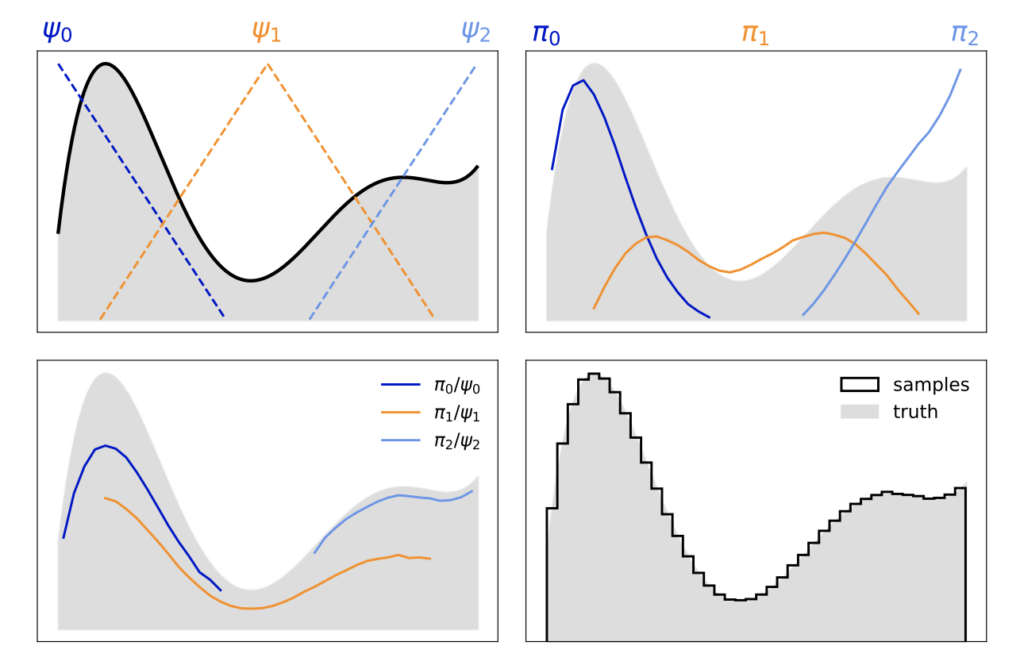
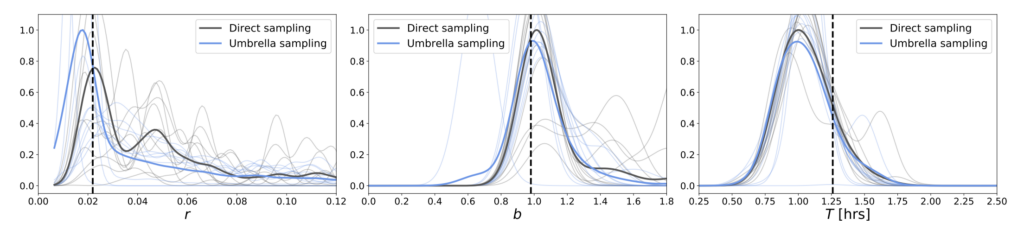
They can use umbrella sampling! Umbrella sampling is a technique that has been used in other scientific fields for decades, but not by astronomers until recently (specifically, Matthews et al. (2018) was the first to introduce umbrella sampling to the field of astronomy). One uses this technique by splitting a distribution into sub-regions, sampling from each of these sub-regions independently, and recombining these samples into a single posterior distribution (Figure 3). The author finds that this technique returns more reliable results than those from standard Monte Carlo methods (Figure 4)!

Four subplots show a somewhat bimodal distribution. On the top left, three dotted lines mark the three sub-regions that will be sampled. On the top right, three solid lines mark the biased distributions. On the bottom left, the three solid lines mark the unbiased distributions, which fit the distribution better. On the bottom right, a black outline demonstrates how well the samples from the three unbiased distributions match the data.
Figure 3. On the top left, the target distribution is split into three sub-regions, each of which is assigned a function. On the top right, after sampling from each of these sub-regions independently, each sub-region is assigned a biased distribution. On the bottom left, the three unbiased sub-distributions are shown. On the bottom right, the three unbiased sub-distributions are combined into a single posterior distribution. (Figure 9 in the paper)
Three plots consisting of multiple grey lines, a single blue line, and a single black line. The grey lines each represent a Monte Carlo simulation, the black line represents the combined Monte Carlo results, and the blue line represents the umbrella sampling results. The blue line is much smoother than the black and grey lines, demonstrating that umbrella sampling is better at exploring the properties of grazing planets.
Figure 4. Posterior distributions of radius, impact parameter, and transit duration for a mini-Neptune orbiting a K-dwarf. The vertical dashed lines represent ground-truth values for this system. These plots demonstrate how standard Monte Carlo methods fail to properly explore the parameters that grazing planets have, and how umbrella sampling produces more robust results! (Figure 17 in the paper)

A good deal of math is needed to properly weight the sub-regions relative to one another; these calculations are described in detail in the paper, and a step-by-step tutorial can be found on the author’s GitHub. Nonetheless, the math is worth it, as this technique can be used to explore any complicated distribution, so it can be used in fields beyond exoplanet science. This means you should get out your umbrellas, ‘cause it’s gonna be raining grazing planets!

Astrobite edited by Jana Steuer

Featured image credit: G. J. Gilbert

About Catherine Clark

Catherine Clark is a PhD candidate at Northern Arizona University and Lowell Observatory. Her research focuses on the smallest, coldest, faintest stars, and she uses high-resolution imaging techniques to look for them in multi-star systems. She is also working on a Graduate Certificate in Science Communication. Previously she attended the University of Michigan, where she studied Astronomy & Astrophysics, as well as Spanish. Outside of research, she enjoys spending time outdoors hiking and photographing, and spending time indoors playing games and playing with her cats.

Leave a Reply