The Undergraduate Research series is where we feature the research that you’re doing. If you are an undergraduate that took part in an REU or similar astro research project and would like to share this on Astrobites, please check out our submission page for more details. We would also love to hear about your more general research experience!
Delina Levine
University of Maryland
Delina Levine is a fourth-year undergraduate studying physics and astronomy at the University of Maryland. She began this research during the 2021 SULI program at SLAC National Accelerator Laboratory under the supervision of Dr. Maria Dainotti. This research was published in ApJ in January, 2022, and was presented virtually at AAS240.
Gamma-ray bursts (GRBs) are highly energetic bursts that can be seen at very far distances. Astronomers are therefore interested in using GRBs as standard candles, or bright objects that allow us to measure cosmological distances. However, GRBs are very varied in their properties, including luminosity, which makes them difficult to standardize.
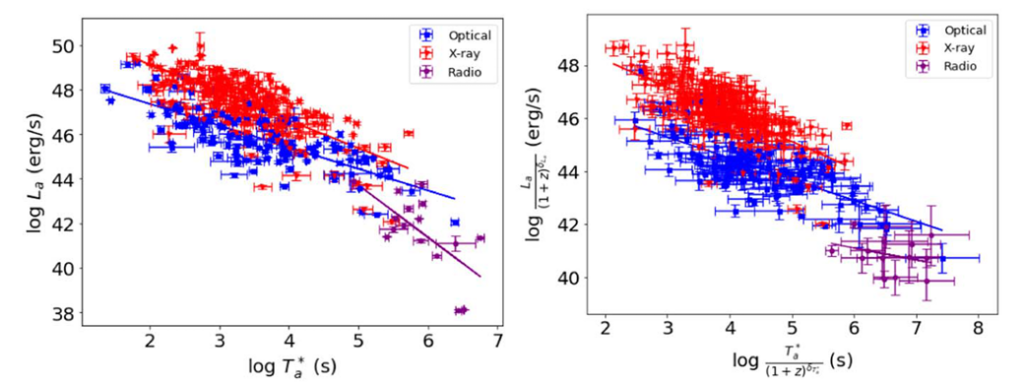
Our research involved searching for a common feature, called a plateau, in GRB radio lightcurves from VLA and ALMA. GRBs can emit in X-ray, optical, and radio wavelengths, and this plateau has previously been found in X-ray and optical lightcurves. This plateau is used to develop a correlation between the end time of the plateau and the luminosity at that time, which has been previously seen in X-ray and optical wavelengths. We found the plateau feature in the radio lightcurves of 18 GRBs, and the luminosity-time correlation exists for these GRBs. After correcting the data for selection biases, we saw that the slope of the radio correlation agreed with that of X-ray and optical. This means the emission mechanism of the GRB may be the same in all three wavelengths and emphasizes the importance of correcting for selection biases in GRB studies.
Astrobite edited by: Sumeet Kulkarni
Featured image credit: ALMA/www.almaobservatory.org/