Authors: L. Ramambason, V. Lebouteiller, S. C. Madden, F. Galliano, C. T. Richardson, A. Saintonge, I. De Looze, M. Chevance, N. P. Abel, S. Hernandez, J. Braine
First Author’s Institution: Institut fur Theoretische Astrophysik, Zentrum für Astronomie, Universität Heidelberg, Germany
Status: Submitted to A&A [open access]
Galaxies’ Invisible Fuel
One of the big issues in studying how galaxies form and change over time is a simple one: the fuel that makes stars, H2 gas (‘molecular hydrogen’, the coldest and densest component of the interstellar medium) is really hard to see! This is because the H2 molecule is symmetric, so it only emits light in a few faint spectral lines that can be studied with telescopes. Instead of studying this gas directly, most astronomers have to rely on tracers – other spectral lines emitted by atoms or molecules that tend to appear where H2 molecules do in galaxies, that have stronger spectral lines than hydrogen.
The most common tracer is carbon monoxide, CO, but other tracers such as [CI], neutral carbon, or [CII], ionized carbon, can also be used. Like many things in life, this isn’t a straightforward conversion – the amount of CO or [CII] light depends on the amount of molecular gas present, but it also depends on other factors like the metallicity or density of the molecular gas. Molecular gas isn’t homogeneous, so even in the same galaxy gas clouds can emit different amounts of tracer spectral lines. We’ve written before about how this makes CO emission really difficult to model, because it depends so much on the small-scale details of galaxies – some types of molecular gas actually don’t emit any CO radiation at all. Nonetheless, astronomers have managed to develop general relations between tracer luminosity and H2 mass that seem to work well in most cases.
Small but Mighty
A lot of work has been put into the tracer relationships that we use, but they don’t work everywhere. One place where the relationships still fail is in dwarf galaxies – the smallest galaxies in the universe. These tend to have very low metallicities compared to bigger galaxies, small amounts of dust, and extremely variable dark-matter-to-baryonic-matter ratios. Despite all this, however, dwarf galaxies are still very important, because we believe they’re the closest analog we have nearby to the very first galaxies, which were probably low-metallicity and small themselves. We don’t have the telescope power to study these primordial galaxies directly, and even when we do have this power, we’ll probably only be able to measure the brightest spectral lines (i.e., a few tracer lines). It’s therefore critical that we understand the tracer relationships in dwarf galaxies, because using them as an analog is the only way we’ll be able to get molecular gas information about the first galaxies in the universe. In today’s paper, the authors aim to do just that.
Complicate it to Make it Simple
In order to study how well tracers like CO estimate the molecular gas mass of galaxies, you first need to know how much molecular gas is actually there so you have something to compare against. The authors of today’s paper use a sample of 18 nearby dwarf galaxies with very detailed measurements (aptly named the Dwarf Galaxy Survey, or DGS), to do this. They calculate the ‘true’ molecular gas mass of the galaxies using a statistical framework that they developed themselves: they assume the galaxies contain many different ‘components’ (hunks of gas with fixed properties such as density and temperature), and use pre-computed chemical models of each component to see what kinds of light they would emit. They then use Bayesian statistics techniques to find the combination of these components that gives each galaxy’s actual spectrum. This is a process that’s complicated, but in the end allows the authors to model exactly how much molecular gas there is in a galaxy. These ‘ground truth’ values can then be compared to the values returned from using single-tracer relationships.
Molecular Gas is Hard
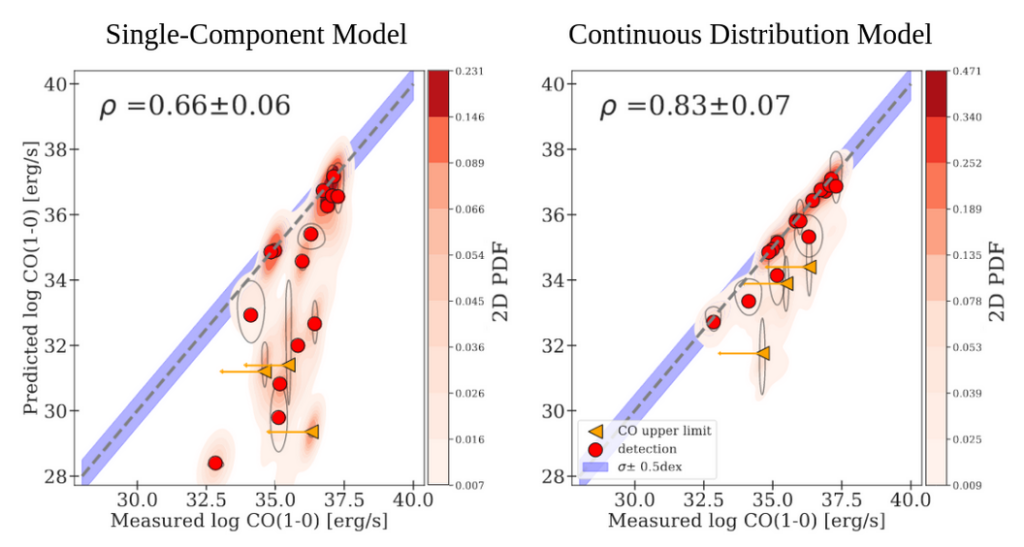
The authors’ first finding in this paper is not a surprising one – molecular gas is complicated! They found that, in order to get a reasonable amount of molecular gas in their simulated galaxies, they needed to sum many different gas components together. So many components were required that they actually changed how they did the modeling. Instead of summing together discrete gas components, they constructed a continuous distribution of gas components – effectively the same thing as summing together a near-infinite number of components. After making this change, the authors found that their model worked very well. Figure 1 shows that, when this distribution model was used, the CO luminosity that was predicted from the fitted distribution of gas components matched the actual CO luminosity of the galaxies extremely tidily.
COnsidering Other Options
Once the authors trusted that their models of the gas in the sample of dwarf galaxies were representative of the galaxies themselves, they were able to explore what tracers worked best for that gas. Unfortunately for CO, it doesn’t seem to be the answer in dwarf galaxies. In fact, as much as 80% of the gas in the DGS sample was found to be CO-dark (i.e., it’s of a metallicity and density that doesn’t emit any CO at all). Luckily, it looks like other tracers can stand in for CO. The majority of the CO-dark gas is of the right metallicity and density to produce both [CI] and [CII] emission, so either tracer could stand in for the CO in future dwarf galaxy studies.
Clump it Up
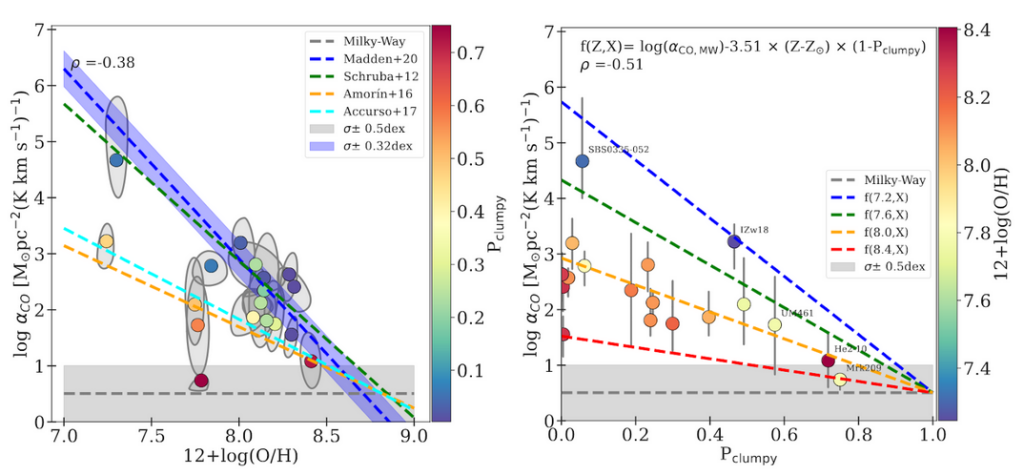
The other question that the authors asked was: if we have to use CO to trace the molecular gas, what parameters affect the conversion between CO luminosity and molecular gas mass the most? The answer was actually surprising: metallicity mattered, but what mattered almost as much was the clumpiness of the galaxies. Galaxies with most of their gas clumped into denser gas clouds had much higher CO luminosities than galaxies with the same amount of gas diffused throughout the whole galaxy. This is shown in Figure 2 – even at low metallicity, the very clumpy galaxies (Pclumpy → 1) had most of their gas emitting CO, so the CO-to-H2 conversion factor αCO was very low.
Ultimately, this paper confirms something we already knew – molecular gas, particularly in edge cases like dwarf galaxies, is very difficult to model and to observe! Still, as the fuel from which new stars are born, it’s a very important phase of the ISM to understand. As we discover more and more about how it behaves in dwarf galaxies, we’ll be more and more prepared to study the very first galaxies in our universe, and understand how the universe as we know it came to be.
Astrobite edited by Lucas Brown
Featured Image Credit: ESA/Hubble