Title: The CMB Cold Spot as predicted by foregrounds around nearby galaxies
Authors: Diego Garcia Lambas, Frode K. Hansen, Facundo Toscano, et al.
First Author’s Institution: Instituto de Astronomía Teórica y Experimental (IATE), CONICET-UNC, Córdoba, Argentina; Observatorio Astronómico de Córdoba (OAC), UNC, Córdoba, Argentina; Comisión Nacional de Actividades Espaciales (CONAE), Córdoba, Argentina
Status: Published in A&A [open access]
Reviewing the Case
The cosmic microwave background (CMB) is the oldest observable light in the Universe, and precise measurements of this light serve as a valuable tool we can use to probe our understanding of cosmology. As a result of density fluctuations in the early Universe, the standard cosmological model predicts the CMB to be a 2.73 K blackbody that varies in temperature at a level of 1 part in 100,000, with the largest of these variations occurring at 1° angular scales. This is exactly what we see when we observe the CMB – a sky filled with hot and cold spots characterized by the standard model’s expectations. However, this is not all we see – we also see a region of the CMB that deviates from the standard model’s prediction (circled in red in Figure 1), which has been puzzling researchers since it was first discovered by WMAP 20 years ago.
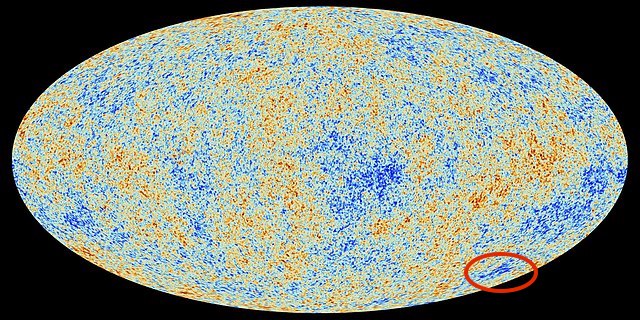
Known as the Cold Spot, not only is this region anomalously cold, boasting temperature decrements up to 7 times greater than that of a typical cold spot, but it is also anomalously large, spanning about 10° on the sky. Although it is possible that such an anomaly could arise given the conditions of the standard model, it has been shown to be statistically unlikely. So, we are left to solve a cosmological case of whodunit. One suspect is a cosmic void lurking in the CMB Cold Spot’s line of sight. This void could induce a gravitational redshift in the CMB photons passing through it via the integrated Sachs-Wolfe (ISW) effect, causing that region of the CMB to appear colder. Although the Dark Energy Survey (DES) has revealed that such a void does exist, this lead may be a red herring, as it has been shown that this void cannot be fully responsible for the Cold Spot signal. Another suspect that has recently been brought forward is the Eridanus supergroup, a clump of three nearby galaxy groups residing in the Cold Spot region: NGC 1407, NGC 1332, and the Eridanus group. It is theorized that the Cold Spot signal could be attributed to the foregrounds of galaxies in and around this supergroup. In today’s paper, the authors investigate this theory in an effort to come closer to cracking the case!
Gathering Evidence
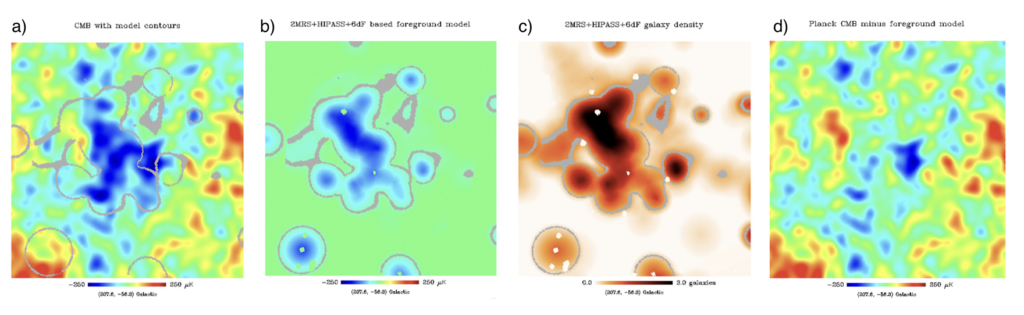
The authors began their investigation by modeling the foregrounds of the galaxies of interest based on data from three galaxy survey catalogs: 2MRS, 6dF, and HIPASS. They compared their foreground model to a CMB temperature map generated from Planck observations and found that their foreground model produced a temperature decrement resembling the CMB Cold Spot in both shape and intensity (shown in panels a, b, and c of Figure 2). They went on to subtract this foreground temperature model from the Planck CMB temperature map and produced a standard-looking CMB map (shown panel d of Figure 2), which supports the notion that the Cold Spot could be attributed to these foregrounds.
Identifying Individual Suspects
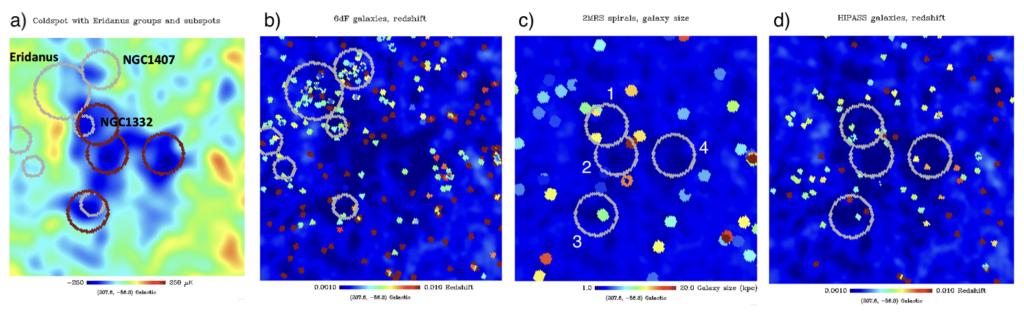
As the next step of their investigation, the authors attempted to identify particular galaxy candidates whose foregrounds could be contributing to the Cold Spot signal. They compared the Cold Spot region of a Planck CMB temperature map to maps of the galaxies examined from each catalog in that region, color-coded by redshift or size (shown in Figure 3). They found that although all the galaxy groups comprising the Eridanus supergroup overlap with the Cold Spot, only NGC1332 coincides with one of the coldest regions, or subspots, of the Cold Spot (subspot 1). However, there are larger galaxies in the 2MRS catalog that are within or close to subspots 1, 2 and 3 that could be responsible for these temperature decrements. Despite there not being a clear 2MRS galaxy candidate for subspot 4, the 6dF and HIPASS catalogs show that there are several galaxies nearby, so this subspot could be caused by one of these galaxies or a superposition of many of these galaxies, though it is also possible that subspot 4 could just be one of the CMB’s standard 1° cold spots.
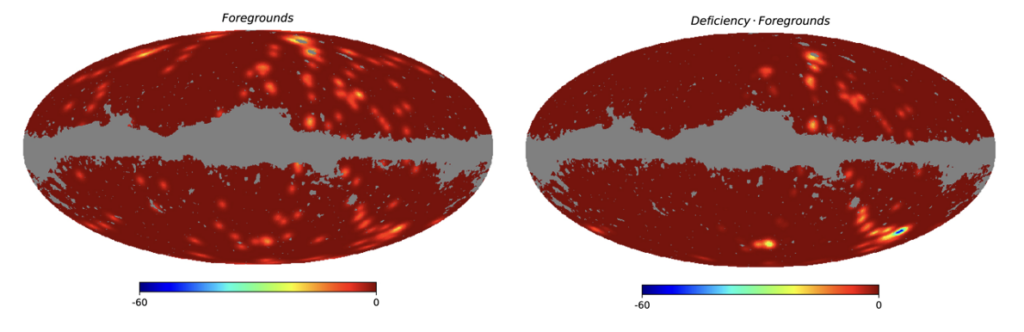
To evaluate these galaxies from another angle, the authors also considered their atomic hydrogen (HI) content. This was quantified by the hydrogen deficiency parameter, which is the fraction of neutral hydrogen that is stripped from the galaxies by tidal interactions. They found that weighting their galaxy foreground map by the most HI deficient galaxies produced a more prominent Cold Spot compared to the unweighted map (shown in Figure 4). This suggests that the stripping of material from these galaxies could play a key role in generating the Cold Spot-inducing foreground.
One Step Closer to Cracking the Case
Although today’s authors have not definitively closed the case of the CMB Cold Spot, they have presented compelling evidence that points to the Eridanus supergroup being the culprit. Their foreground model of the galaxies in and around the Eridanus supergroup produces a cold region that is strikingly similar to the CMB Cold Spot. They were also able to pinpoint particular galaxies that could be responsible for the Cold Spot signal and demonstrated that the tidal stripping of these galaxies could be the mechanism behind its existence.
Astrobite edited by Abbe Whitford and Yoni Brande
Featured image credit: adapted from ESA and the Planck Collaboration