Authors: Beth A Biller, Johanna M. Vos, Yifan Zhou, Allison M. McCarthy, Xianyu Ta , Ian J. M. Crossfield, Niall Whiteford, Genaro Suarez, Jacqueline Faherty, Elena Manjavacas, Xueqing Chen, Pengyu Liu, Ben J. Sutlieff, Mary Anne Limbach, Paul Molliere, Trent J. Dupuy, Natalia Oliveros-Gomez, Philip S. Muirhead, Thomas Henning, Gregory Mace, Nicolas Crouzet, Theodora Karalidi, Caroline V. Morley, Pascal Tremblin, Tiffany Kataria
First Author’s Institution: Institute for Astronomy, University of Edinburgh, Royal Observatory, Edinburgh EH9 3HJ, UK
Status: Published in the Monthly Notices of the Royal Astronomical Society [open access]
Brown Dwarfs: Better Than Planets?
Brown dwarfs are “substellar” objects that bridge the gap between stars and planets: too small to fuse hydrogen like stars (hence the term “failed star”), yet too big to be a planet like Jupiter. These intermediate objects act as ideal “laboratories” for planet-like atmospheres. Despite being more massive than planets, they have atmospheres similar in temperature and composition to those of giant planets. Brown dwarfs are often free-floating, or not bound to a host star, meaning that we can look at them without being blinded out by nearby starlight.
Single snapshots can help provide us with some knowledge of an object’s atmosphere, like its composition, but we know from objects in our own solar system that their atmospheres are complex. Substellar objects like brown dwarfs and giant planets are expected to have clouds, bands, storms, and other dynamic processes that we want to study. To study these features, we need to go beyond single snapshots and turn to time-series observations. As a brown dwarf rotates, its brightness periodically changes as different features come in and out of view, which we can use to generate a rough idea of its atmospheric conditions!
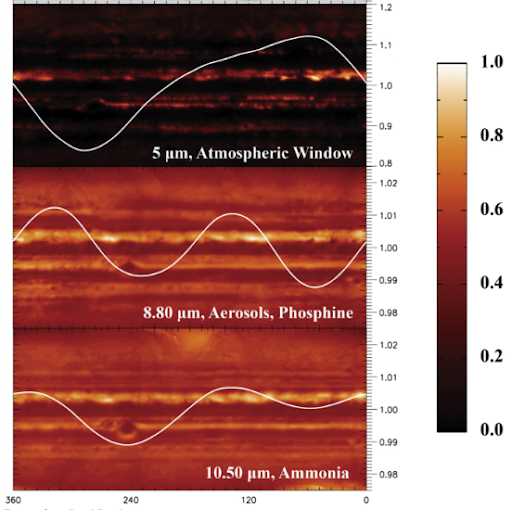
Crucially, variability looks different depending on the wavelengths observed (see Fig. 1). This happens because certain molecules and clouds block out, or absorb, specific colors of light, acting like fog. Less “foggy” (opaque) wavelengths allow us to see deeper into the atmosphere, while more opaque wavelengths only reveal the features at the top. By observing a wide range of wavelengths simultaneously, we can piece together a multi-dimensional picture of the atmosphere’s structure. The wider the range, the better!
WISE 1049AB: Our Brown Dwarf Neighbors
In our highlighted paper, the authors use the revolutionary power of the James Webb Space Telescope (JWST) to do just this. Using its near-infrared instrument NIRSpec and mid-infrared instrument MIRI, they captured the widest wavelength coverage (~0.8-10 microns) and longest continuous monitoring ever achieved for a brown dwarf, a feat simply not possible with predecessor telescopes. Their chosen target is a notable one: the binary brown dwarf system WISE 1049AB (Luhman 16AB), the closest brown dwarfs to Earth. WISE 1049A is a hotter L-dwarf and WISE 1049B is a cooler T-dwarf. Together, they bridge the L/T transition—a dramatic phase where silicate and iron clouds break up as brown dwarfs cool, which is thought to drive strong variability. Observing this system therefore provides the ideal experimental conditions for studying this transition.
The Variability is Variable!
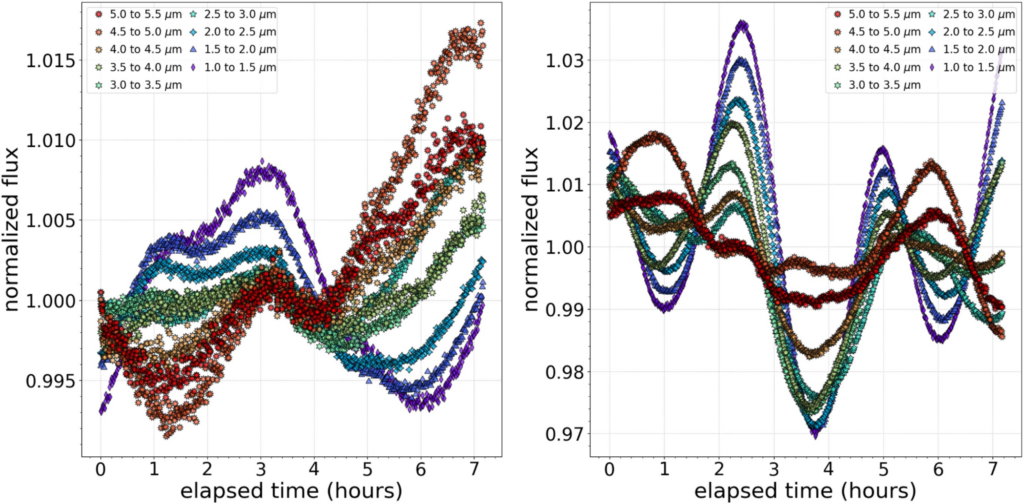
The JWST observations confirmed that both objects are variable, with the cooler T-dwarf, WISE 1049B, showing stronger variability, as seen in previous studies. More notably in Figure 2, the light curves (plots of brightness over time) change in shape dramatically with wavelength, indicating that the variability itself is also variable.
Focusing on the NIRSpec data (0.8-5 microns), the most striking result is seen in WISE 1049B. At the shortest wavelengths (< 4 microns), its light curve has a distinct sinusoidal shape, with two bright peaks appearing about 2.5 hours apart. Yet after crossing this ~4 micron threshold, the light curve morphs into a more complex shape, with bright peaks now separated by its full ~5-hour rotation period (see Fig. 2).
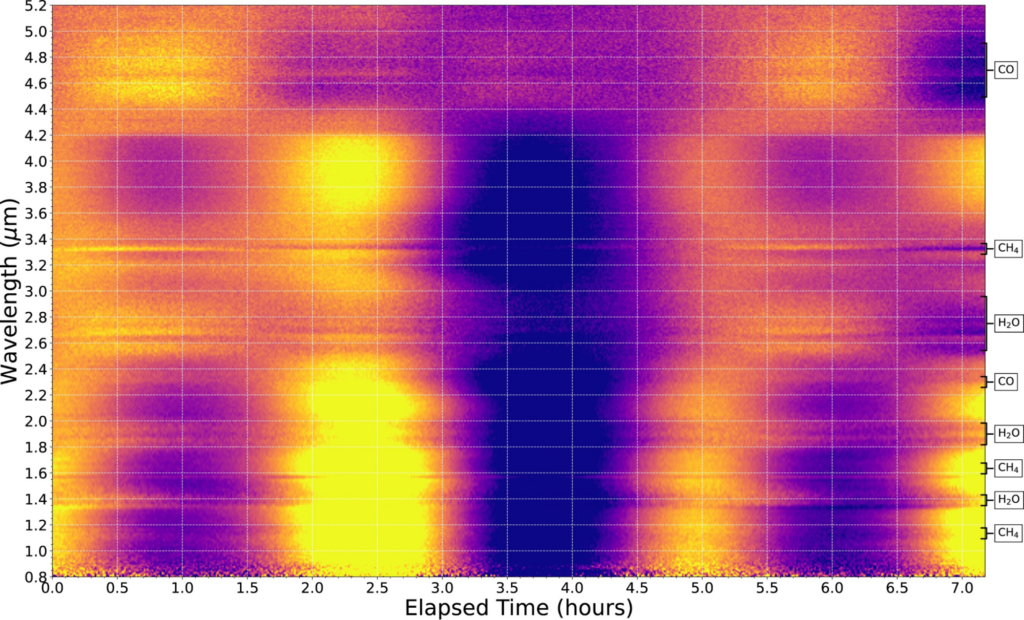
So what causes these distinct variability patterns? The authors created “variability maps” (see Fig. 3) that show how the light curve behavior changes across all wavelengths. They found that the sudden changes in light curve shape align well with the locations of strong molecular absorption features from water (H\(_{2}\)O), methane (CH\(_{4}\)), and carbon monoxide (CO). This supports the idea that individual molecules play a part in shaping the observed light curve, each providing a unique view into processes taking place in different layers of the atmosphere.
Putting everything together, the authors paint a picture of a layered, dynamic atmosphere that is responsible for these changing light curves. They interpret the different light curve shapes as detections from three distinct pressure levels:
- A deep layer drives the strong sinusoidal variability seen at the shortest (< 2 microns) and longer (> 8.5 microns) wavelengths.
- An intermediate layer represented by the light curves between 2 and 4 microns.
- A high-altitude layer which produces the complex, plateaued behavior seen between 4 and 8.5 microns.
The results provide an exciting demonstration as to how JWST can take time-series observations to the next level, allowing astronomers to effectively probe the multi-layered structure of atmospheres outside our own solar system. Future work will continue to provide ground-breaking results on the atmospheres of other brown dwarf and planetary-mass objects.
Astrobite edited by Munira Hoosain and Neev Shah
Featured image credit: Pablo Carlos Budassi @ Wikimedia Commons