Title: A New Boundary Condition on Reionization
Authors: Sarah Libanore, Ely D. Kovetz, Julian B. Muñoz, Yonatan Sklansky, Emilie Thélie
First Author’s Institution: Department of Physics, Ben-Gurion University of the Negev, Be’er Sheva 84105, Israel
Status: Accepted in Physical Review D [closed access]. Preprint available on arXiv.
Meet the Epoch of Reionization
Today, most of the matter between galaxies is made up of ionized gas, but this wasn’t always the case. In the early Universe, the intergalactic medium (IGM) was filled with neutral hydrogen (HI) gas. The transition from a neutral to an ionized IGM happened during the Epoch of Reionization (EoR). The EoR was ushered in by the formation of the first stars and galaxies, which, for the first time in the history of the Universe, started emitting light energetic enough to ionize the HI gas. Since early galaxies were the driving force of reionization, the EoR proceeded by first ionizing the IGM closest to the galaxies, then progressing outwards, forming what are known as reionization bubbles (see Figure 1 in this linked Astrobite). Eventually, the bubbles grew large enough that they merged into the completely ionized IGM we have now. Check out this cool video for a simulation of this process!
In reality, we don’t know much about the EoR yet, because we don’t currently have any direct observations of this era. We have some idea of when it ended (~1 billion years after the Big Bang) thanks to distant quasars, and a rough estimate of how long it lasted thanks to the Cosmic Microwave Background (see this post for an overview of these methods). However, the timeline of reionization is still very uncertain, and current methods are imprecise and heavily dependent on assumptions.
A better understanding of how reionization proceeded will help us understand a lot about the first population of stars, how the first galaxies formed, as well as the expansion history of the Universe. In this paper, the authors come up with a new method to determine when reionization started, which can be applied to upcoming data.
21-cm Line-Intensity Mapping to the Rescue!
Thankfully, there are ways to observe the EoR directly, the most promising of which is to measure the 21-cm line emission of HI. We should see this 21-cm light intensity gradually decrease during the EoR as the HI in the IGM disappears by ionization. Next generation radio telescopes such as the Square Kilometer Array (SKA) will be able to produce maps of 21-cm light intensity throughout the EoR, using a technique called line-intensity mapping (LIM), allowing us to directly see the EoR for the first time!
The time-evolution of the EoR is something that we can directly observe in these maps, thanks to an important phenomenon called cosmological redshift. Since the Universe is expanding, older light, which has spent longer travelling through expanding space, is going to be stretched (or redshifted) to longer wavelengths when it arrives at our telescopes, than younger light. Hence, redshift (denoted “z” in the figures) is a proxy for time! Larger redshift = further back in time. By tuning our telescope to the right observing wavelengths, we can therefore make maps of redshifted 21-cm emission which correspond to snapshots in the EoR timeline!
Starting with Cross-correlations
However, 21-cm observations are challenging because the 21-cm signal from the EoR is very faint compared to the light from our own galaxy, and systematic instrument noise from the observing telescope. Even with maps from the SKA, we will still have to make sure we are not mistaking noise for our EoR signal.
In cosmology, a common way to help detect things that are too faint to see in individual datasets is cross-correlating two different types of data together, i.e. measuring how similar these two datasets are. Cross-correlating them allows you to extract the common signal while not picking out things like noise, which are different for different types of data. Cross-correlations are a very popular tool for LIM, especially 21-cm. For example, see this and that Astrobite.
One simple cross-correlation statistic you can calculate is the Pearson cross-correlation coefficient, P, a single number which indicates how correlated your two datasets are, on average. Given two cross-correlated maps A and B:
- P=1 means your maps are perfectly correlated: if a point on map A has a higher value than average, then the corresponding point on map B will always also have a higher value than average.
- P=-1 means your maps are perfectly anti-correlated: if a point on map A has a higher value than average, then the corresponding point on map B will always have a lower value than average.
- P=0 means your two maps are completely un-correlated: knowing the value of a point on map A tells you nothing about the value of the corresponding point on map B.
In this paper, the authors argue that they can pinpoint when reionization started by cross-correlating 21-cm maps with LIM maps of another emission line, this time from doubly ionized oxygen(OIII), which traces star formation during reionization. The brighter a location on the map is in this OIII line, the faster stars are forming at that location. Similarly, the brighter the 21-cm emission, the more HI there is. Since energetic light from stars in galaxies is what ionizes the hydrogen, we expect the 21-cm signal and OIII signal to have some degree of anti-correlation which changes as reionization progresses!
A Correlation Drop at Reionization
From simulated 21-cm and OIII maps, the authors noticed that a drop in the Pearson correlation coefficient tends to happen when the ionization fraction (the fraction of the IGM hydrogen that is ionized) is <10%. This prompted them to look further into the Pearson drop as a sign of early EoR stages.
So, what causes the Pearson correlation drop during the early EoR? At the very start of reionization (~1% ionization), regions where stars are forming (highest OIII brightness) are the regions where there is the most HI (highest 21-cm brightness). Therefore, we have a pretty high positive correlation between OIII and 21-cm. Once reionization picks up the pace (~5-10% ionization) and ionized bubbles begin to form around galaxies, the regions with the highest star formation rates (highest OIII brightness) become the regions that ionize the HI IGM the fastest (lowest 21-cm brightness), leading to a drop in the Pearson correlation curve as we move to lower redshift and bubbles grow. You can see this evolution in the left plot of Figure 1.
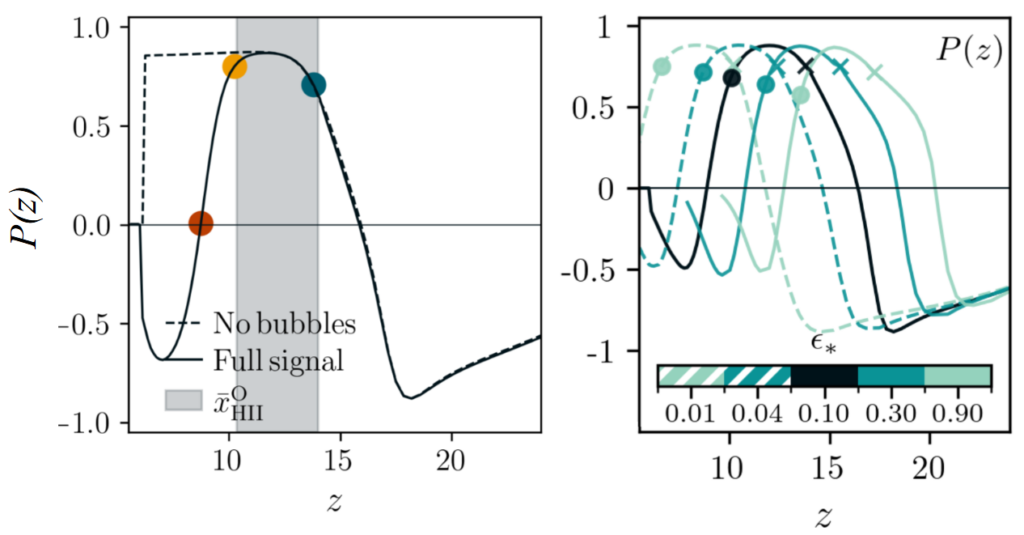
Furthermore, this correlation drop at <10% ionization still happens even when using drastically different assumed models for early stars and galaxies. You can see this in the right plot of Figure 1, which shows how the Pearson coefficient’s redshift evolution P(z) changes when varying the efficiency of early star formation. Even though the curves may shift around, one thing they have in common is that the 10% ionization dot is always at a lower redshift (later time) than when the Pearson coefficient starts to drop after the peak.
Good News: Model-Independence
The authors run 350 models randomly varying three different astrophysical parameters to test if the Pearson drop still happens at an ionization fraction <10% in such a wide range of models.
The result is in Figure 2. Each of the orange dots corresponds to one of the 350 tested models. The x-axis is the redshift at which the ionization fraction is 10%, and the y-axis is the redshift at which the Pearson drop happens. The grey shading indicates what ionization fraction the Pearson drop actually happens at.
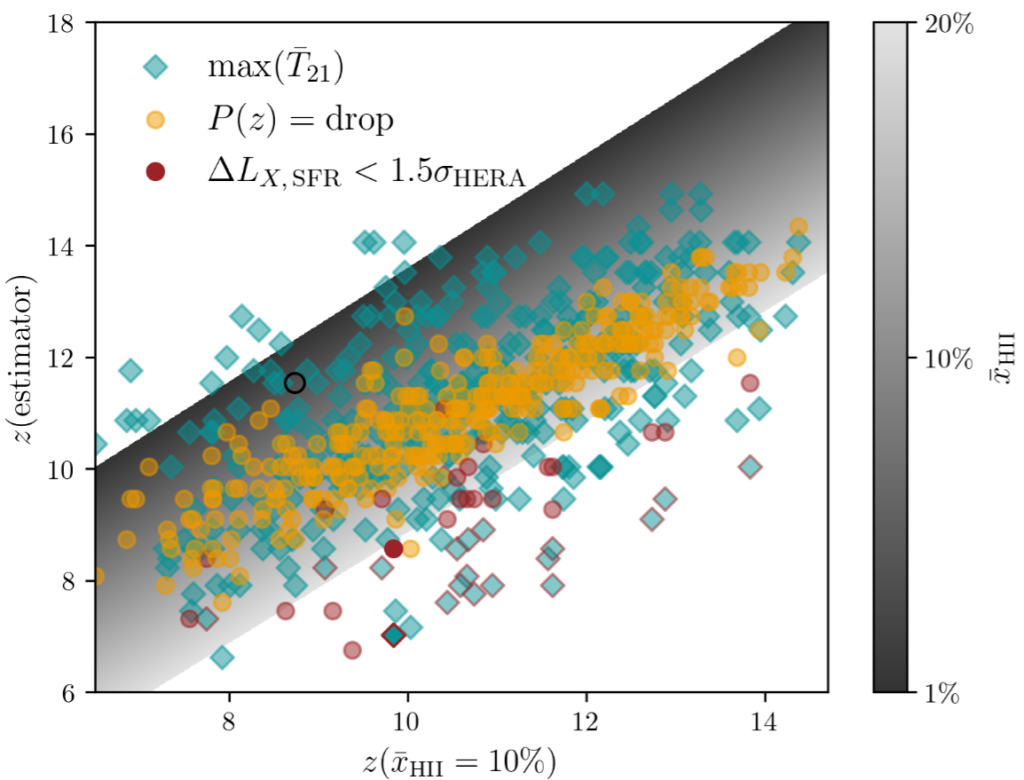
You can see from Figure 2 that most of the orange dots are in the ~1-15% ionization grey shading zone. More specifically, for 90% of the models, the Pearson drop happens at ionization <15%. This high consistency between 350 different models is a promising sign that the Pearson drop might be a new, model-independent way of putting a lower bound on the redshift of the start of reionization! Put differently, if we are able to detect the Pearson drop at a specific redshift in our data, then we’ll know that the Universe was likely less than 15% ionized at this redshift. Hence, we would have a much better idea of when the Universe was in early reionization stages than we currently do!
Cross-correlation Surpasses 21-cm Alone
As an aside, the cyan squares in Figure 2 run the same test, but on a different possible method to detect the early EoR: the peak of the average 21-cm brightness as a function of redshift (also called the ‘global 21-cm signal’). The cyan squares are more scattered, meaning they are more spread out on the plot, than the orange dots. This means that the ionization fraction at which the 21-cm signal peaks is more model-dependent than the Pearson drop. This makes the 21-cm signal alone a worse way of estimating when reionization started. Point for the Pearson drop, and point for cross-correlations!
What Are Our Chances?
So, how close are we to actually detecting this Pearson drop in data? New telescopes like the upcoming SKA-Low (for 21-cm, coming 2027) and the already-observing SPHEREx (for OIII), will very soon be making maps of the EoR. The authors give an encouraging preliminary estimate of the Pearson coefficient’s detectability from these two telescopes. However, their upcoming papers will feature a more rigorous analysis since here they have not accounted for foreground light or for detailed instrumental noise or systematics.
Although more detailed investigation is necessary to establish the viability of this reionization probe, it is an exciting prospect, and this paper is a great example of how brand-new ideas are presented to the wider research community in early stages of study!
Astrobite edited by Veronika Dornan
Featured image credit: Original image by M. Alvarez (http://www.cita.utoronto.ca/~malvarez), R. Kaehler, and T. Abel/ESO. Modified with overlaid cartoon graphics by Laurie Amen.