- Title: Directional Statistics for Polarization Observations of Individual Pulses from Radio Pulsars
- Author: M. M. McKinnon
- Institution: National Radio Observatory, Soccoro, NM, USA
In the opening paragraph of his paper posted on the arXiv, McKinnon states that, “The four fundamental measurements made in astronomy are the intensity, flux density, or surface brightness of the electromagnetic radiation emitted by a celestial object, the wavelength, or frequency, of the radiation, its location on the sky, and the polarization of the radiation.” Astronomical observational methods such as photometry, spectroscopy, and CCD imaging are used to analyze these properties of light to characterize the astronomical source of interest. Another method, polarimetry, is another method used to study the polarization of incoming radiation and can provide substantial clues to the nature of the source. Polarimetry is used to extract information such as the strength of magnetic fields in the interstellar medium (ISM), provide evidence for inflation by observations of the CMB polarization, and motivate a unified model for active galactic nuclei (AGN).
Emitted light travels in electromagnetic plane waves from an astrophysical source towards the earth. Plane waves are described by oscillating electric and magnetic
fields, whose field vectors are generally orthogonal to each other and the direction of propagation. By convention, astronomers describe the polarization of light only in terms of the electric field vector (because
and
are orthogonal). The polarization can be described by the shape that the tip of
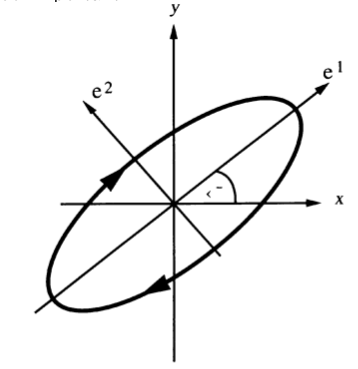
traces out over the course of a period (Figure 1), and it can be linear, circular, or elliptical, which is a mix of the two. For example, circular polarization can be represented as the superposition of two orthogonal linearly polarized waves that are out of phase with each other by 90 degrees (thus,
and
form the basis vectors). (Wikipedia has a nice animation). Later, we’ll see that we can also choose left and right hand circular polarized modes (LCP and RCP) as orthogonal basis vectors.
The Stokes parameters are a convenient way to define the polarization ellipse of the observed radiation. They can also be easily measured, and for this reason they are commonly used in astronomy. The parameters are usually stated as I, Q, U, and V (or sometimes as , respectively). I is the intensity of the radiation, Q and U are measures of the orientation of the ellipse relative to the x axis, and V is the measure of the circularity of the polarization (ie, right or left circularly polarized). For an in-depth discussion of the Stokes parameters, see chapter 2 of Radiative Processes in Astrophysics by Rybicki and Lightman.
The Poincaré sphere (Figure 2b) is a construction used to visualize the relationship between the Stokes parameters by using Q, U, and V as orthogonal vectors. For example, completely left or right circularly polarized light is described by V of +1 or -1 (depending on your convention), and Q, U of 0. This can be seen by the circular arrows at the poles of Figure 2a.
Statistics provides an extremely important collection of tools that scientists use to analyze their data. Astronomers in particular must pay careful attention to the significance and error of a measurement because they are usually operating with data that has a low signal and significant amount of noise. They need to know when they can trust their results. When working in spherical coordinates, (or any coordinate system other than cartesian), one needs to be careful how they generalize statistical distributions. (For an interesting example of the translation to spherical coordinates, check out Wolfram’s description of how to generate a uniform spherical distribution). This generalization of statistics to other geometries is called directional statistics.
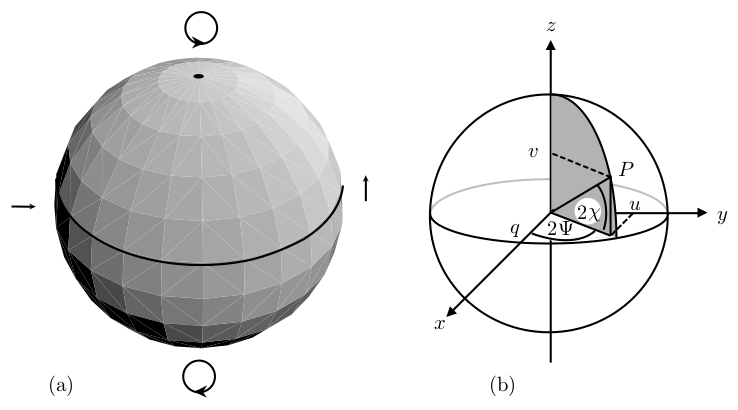
Figure 2a and 2b: The Poincaré Sphere is used to graphically show the relation between the Stokes parameters. Figure from Kennett and Melrose 1998.
In Directional Statistics for Polarization Observations of Individual Pulses from Radio Pulsars, McKinnon describes how it is possible to apply directional statistics to the Poincaré sphere. This makes polarization observations a three-dimensional statistical problem.
In cold plasmas like the interstellar medium (ISM) with small intrinsic magnetic fields (on the order gauss), the natural modes are left and right hand circular polarized waves (LCP and RCP). This means that any polarization (including linear polarization!) can be described by the superposition of LCP and RCP waves of varying amplitude and phase. In a birefringent medium like the ISM, the different propagation speeds of these modes will serve to rotate the plane of polarization of the electromagnetic wave, as one mode of propagation lags behind the other, and the phase difference changes. This phenomenon is called Faraday Rotation.
Pulsars are rapidly rotating neutron stars, with periods ranging from a millisecond to tens of seconds. They are highly magnetic, with fields as high as gauss (for comparison, the Earth’s magnetic field is
gauss at the surface). Astronomers believe that pulsars emit radiation in two, orthogonal polarization modes (OPMs) (Edwards, 2004), and that observations can be explained by the superposition of these two modes. Faraday rotation can be generalized to apply to the intense electromagnetic fields present in the magnetosphere of pulsars, where the natural modes are thought to be linearly polarized. By applying directional statistics to the Poincaré sphere, this versatile model of pulsar observations can explain a wide range of polarization observations of pulsars from pure instrumental noise to a complex superposition of polarizations.
While not directly related to Faraday rotation, the dispersion in the arrival time of the pulse can be used to measure the distance to the pulsar. Because the speed of propagation of electromagnetic waves through a medium (such as the interstellar medium) is dependent upon the frequency of the wave, higher frequency waves will travel through the ISM faster than lower frequency waves. Thus, there will be an observed lag between pulses observed at different frequencies.
Where to go for further introductory material
- Pulsars
- Introduction to Modern Astrophysics by Carroll and Ostlie, Chapter 16.
- Stokes Parameters
- Radiative Processes in Astrophysics by Rybicki and Lightman, Chapter 2
- Faraday Rotation and Plasma Effects
- Radiative Processes in Astrophysics by Rybicki and Lightman, Chapter 8
Figure References
- Propagation-induced Circular Polarisation in Synchrotron Sources, Kennett and Melrose 1998



Trackbacks/Pingbacks