Title: The Albedos of Kepler’s Close-in super-Earths
Author: Brice-Olivier Demory
Author’s institution: Astrophysics Group, Cavendish Laboratory, Cambridge
Status: ApJ Letters, in press
Kepler, the space telescope that searches for transiting planets, has found a lot of super-Earths, planets a few times larger than Earth but too small to be giant planets. Since these types of planets are not seen in our Solar System, their composition is not well understood. Are they more like Earth, or more like Neptune, or something completely different?
From Kepler and follow-up studies, we can measure the masses and radii of these super-Earths. This gives us the bulk density, but planetary models are degenerate when trying to determine the bulk composition. The bulk density alone, for example, cannot help us distinguish between a planet with a dense iron core and a thick gaseous atmosphere and a rocky planets with little or no atmosphere. The atmospheres of transiting planets have been probed with several techniques such as transmission spectroscopy, occultation and phase curve photometry. So far, only three super-Earths have been characterized using these methods because they require bright planets. Kepler, however, has a wealth of data on super-Earths. Kepler can quickly and easily detect planets that are close in, and therefore transit more often. These close-in planets are highly irradiated by their stars and reflect back a lot of light.
This paper by Brice-Olivier Demory explores the reflective properties of super-Earths and looks for occultations in the Kepler data. Occultations refer to the opposite of a transit. A transit is when the planet passes in front of the star, and an occultation is when the star passes in front of the planet, blocking out the reflected light of the planet. For close in planets, the light reflected off the planet’s surface can be quite bright, and the occultation will produce a noticeable dip in the light curve, but much fainter than the transit. The purpose of this work is to characterize the total emission from the planet, which is a combination of reflected light from the star and the thermal emission from the planet itself.
Methods
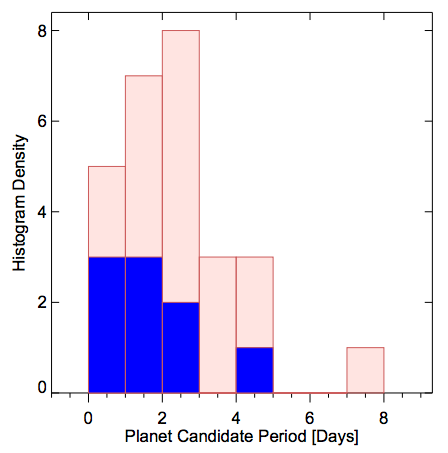
Figure 1 – Histogram of the super-Earth sample with (blue) and without (red) occultation signals detected vs. orbital period in days. The frequency of occultations seen decreases with orbital period as expected. FIgure 1 from Demory (2014).
Demory used three years of Kepler data to select 97 Kepler detected planet candidates with planet radii RP < 2.25 REarth and periods less than 10 days. About 5-15% of these candidates are expected to be false positives. Demory set up stringent criteria the planet had to meet before being including in the sample to reduce the risk of false positives skewing the results. 27 of the original 97 super-Earths met these standards.
Demory used a Markov Chain Monte Carlo algorithm to fit the light curves to constrain the planet properties and find occultations in the data. 9 of the 27 planets show a clear occultation signal. Figure 1 shows a histogram of the planets with and without occultations vs. orbital period. The number of planets that show an occultation decreases with orbital period. This is a good check that these are unlikely false positives since this is the behavior expected for real planets because the occultation signal is harder to detect for planets orbiting farther from their star.
At Kepler wavelengths, both the thermal and reflected light from the planet is measured, so the occultation is not a direct measure of the albedo. For this paper, Demory defines the “total” albedo as a direct translation of the occultation, containing the signal from both thermal and reflected light. Demory also compared the brightness temperature of the planets vs the equilibrium temperature. The brightness temperature is a way of converting the measured brightness of an object into a temperature since, for many astronomical objects like stars, hotter objects are brighter than cooler objects. The equilibrium temperature is how hot an object is expected to be given its distance from the star it orbits. This is how habitable zones for stars are calculated, by determining the location where an object’s equilibrium temperature would be just right for liquid water.
Results
The super-Earths showed a large range of measured albedos and also have larger brightness temperature excesses (over the equilibrium temperature) than hot Jupiters. Figure 2 shows the difference in the brightness temperature and equilibrium temperature vs the equilibrium temperature for the sample of super-Earths (black points) and other known hot Jupiters (green triangles). The super-Earths all have higher brightness temperatures than their equilibrium temperatures and many have larger excesses than is seen in the hot Jupiter population.
To fully understand these data, we need more planetary models and more data for comparison. The reflected light seen with Kepler could come from several sources: 1) reflection off the surface, 2) Rayleigh scattering off particles in the atmosphere, or 3) reflective clouds. Super-Earths with larger albedos seen in this sample should be followed up with more sensitive instruments because they are good candidates to study the composition of their surfaces. In the future, we need a larger survey with better precision measurements to study the characteristics of the population as a whole.
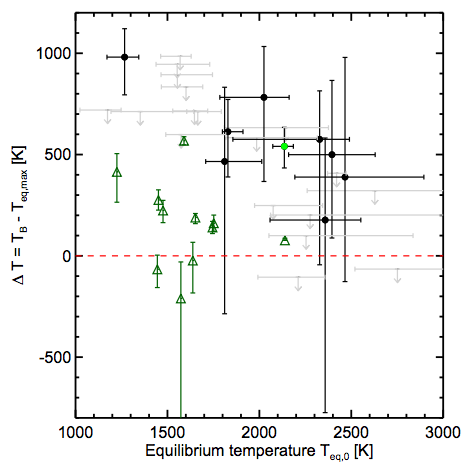
Figure 2 – Difference between the brightness temperature TB and the equilibrium temperature Tequil vs. the equilibrium temperature. The occulting super-Earths are shown in black and the super-Earths without a clear occultation signal are shown in gray as upper limits. The green triangles are hot Jupiters and the green point is Kepler-10b. The super-Earths show larger brightness temperature excesses than the hot Jupiter population. Figure 3 from Demory (2014).
Author