Title: The Luminosities of the Coldest Brown Dwarfs
Authors: C. G. Tinney, Jacqueline K. Faherty, J. Davy Kirkpatrick, Mike Cushing, Caroline V. Morley, and Edward L. Wright
First Author’s Institution: UNSW, Australia
Status: Accepted to The Astrophysical Journal
Y dwarfs are a new addition (since 2011) to the very bottom of the stellar classification scheme. The trusted mnemonic “Oh, Be A Fine Girl/Guy, Kiss Me” might need some extra words, because we keep finding examples of cooler and cooler objects, including the L, T, and now Y dwarfs. A brown dwarf is often thought of as a failed star; it might fuse deuterium at some point, but isn’t massive enough to sustain hydrogen fusion. There is also ongoing debate over what the dividing line is between a brown dwarf and a planet, since at the smaller end of their distribution, these objects resemble large Jupiters much more than a tiny sun. Y dwarfs have temperatures less than 500K and masses between only 5 and 30 Jupiter masses. Temperature-wise, this places them neatly between the gas giants in our own solar system, around 130K, and the planets we find by direct imaging, at 1000-1500K. As you might imagine, finding these guys can be tough, and we’re only just beginning to understand their complicated atmospheres. Luckily brown dwarfs are relatively numerous, so there are enough close-by that we can sort out some answers.
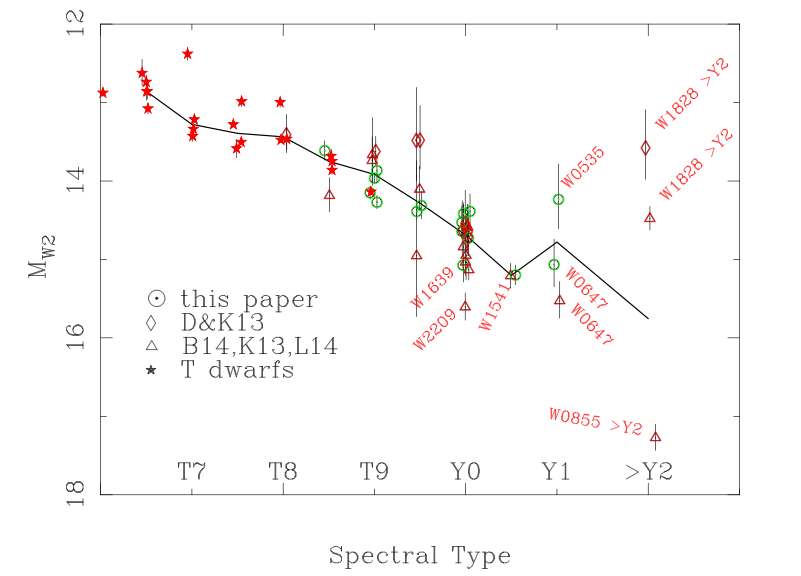
Figure 1. Spectral type – magnitude diagram. You can clearly see in this chart that some objects’ assigned spectral type and measured absolute magnitude puts them well outside the established trend.
One of the most basic questions we ask about an object in astronomy is, “How bright is it?” Finding accurate bolometric luminosities depends on knowing the absolute magnitude, and therefore an accurate distance to these objects. For brown dwarfs, this is usually found by trigonometric parallax, which is always challenging. The authors illustrate this by pointing out that an object at 25 pc will move by only 40 milliarcseconds. That’s an incredibly tiny distance to measure accurately, yet techniques are always improving. The authors therefore conducted a targeted search for the parallax motions of very faint Y dwarfs, in order to achieve more accurate absolute magnitudes.
They plot their results first in a spectral type-magnitude diagram in Figure 1. They plot T dwarfs for comparison at the brighter, hotter edge of the diagram, to show how the Y dwarfs fit it to the larger trend. The authors point out that spectral type (which is assigned by looking at the shape of an object’s spectrum), can be difficult to pin down for these objects, and is usually uncertain at about the .5 sub-type. So a T9.5 could actually be a Y0. But even with this uncertainty, there’s a lot of scatter, with many objects on this plot falling well away from the median line (in black). This means they are substantially either brighter or dimmer than can be explained by the uncertainties.
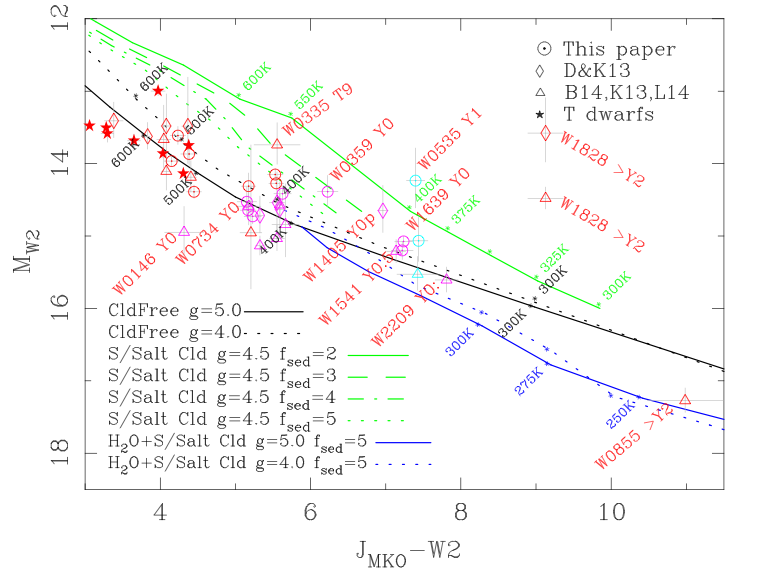
Figure 2. Color-magnitude diagram. Lines represent a variety of atmospheric models with different kinds of clouds. These serve as predictions for where objects are expected to fall on the plot. The presence and type of clouds can affect the observed color of the object.
The same scatter carries over to Figure 2, a more traditional color-magnitude diagram. Part of the scatter is due to the fact that accurately modeling these objects is extremely challenging. At these low temperatures, all kinds of molecular features come into play, and cloud physics and radiative transfer are tricky to calculate. Consequently, we have a range of expectations for where we expect to see these Y dwarfs on a color-magnitude diagram, and even with that range, there are objects that are far too bright for their color. The authors suggest that these could be unresolved binaries, in which case adaptive optics imaging could resolve the issue.
Another option for targets missing the predicted lines is that they are cloudy. The bands used for this study are the near infrared J band, a filter which peers deep into the atmosphere, and the WISE W2 band, whose flux is emitted from high altitudes. Sulphide and salt clouds form lower in the atmosphere, decreasing J band flux and making objects redder than their cloud-free equivalents, in which case they will sit above predicted trendline and appear overly bright. On the other hand, water ice clouds form higher in the atmosphere and affect the W2 band more strongly, so they will cause bluer colors, and these objects may appear too dim.
Of course, at some point, this all comes back to physics. Why do we see such large scatter on the color-magnitude diagram between otherwise similar objects? Why should one Y dwarf have thick clouds and another an almost transparent atmosphere? The answer probably lies in cloud variability. We have evidence for L and T dwarfs showing variability in time, so it would not be too surprising to see that the same Y dwarf could wander around this diagram as it rotates, showing us a cloudy side one day and clear skies the next. So now that we know where at least some of these Y dwarfs are, it’s time to watch them very carefully, and see what they can tell us about their clouds.


Trackbacks/Pingbacks