Title: GMC Collisions as Triggers of Star Formation. II. 3D Turbulent, Magnetized Simulations.
Authors: Benjamin Wu, Jonathan C. Tan, Fumitaka Nakamura, Sven Van Loo, Duncan Christie, and David Collins.
First Author’s Institution: Department of Physics, University of Florida, Gainesville, Florida, USA.
Paper Status: Submitted to ApJ.
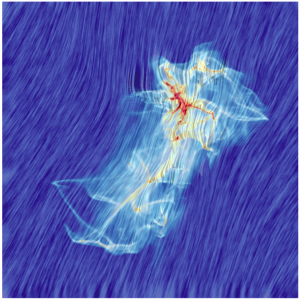
Featured image: Visualization of the gas surface density and the magnetic field orientations for the cloud collision simulation. The beautiful and accurate depiction of the magnetic fields is the marriage between science and art, created by the Linear Integral Convolution (LIC) method.
It is human nature to want to smash things, and warmhearted astronomers are no exception. We have smashed galaxies together to make stars and black holes. We do it for science! When it comes to modeling astrophysical phenomena, we have to go beyond idealized setups; smashing things together is a good way to create realistic environments. The main purpose of theoretical modeling is to help make sense of the complexity we see in nature after all.
Star formation occurs in gas clouds known as giant molecular clouds consisting mainly of molecular hydrogen. Like clouds in the sky, molecular clouds take all kinds of shapes and move at different speeds at different times. The same is true for star-forming molecular clouds. We can now actually observe the dynamics of such molecular clouds in high resolution.
Star-forming molecular clouds are shaped by turbulence and magnetic fields. However, modeling their effects on star formation is a nontrivial business because turbulence and magnetic fields affect each other, and one has to resort to numerical simulations. The authors of today’s paper simulated the collisions of pairs of turbulent spherical clouds with different magnetic fields, collision velocities, and collision trajectories. Their work includes an extensive series of simulations to probe how different collision parameters determine the resultant star-forming environments. Using these simulations, the authors show how observers can test whether real molecular clouds have experienced collisions in the past.
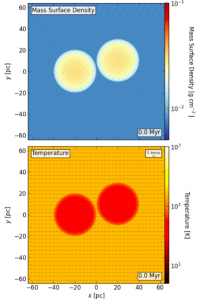
Figure 1. Initial states of the cloud collision simulation. The upper panel shows the gas surface density together with the initial magnetic field lines (grey lines), the bottom panel shows the gas temperature with the gas velocity vectors (black arrows). When the collision simulation begins, the two clouds move towards each other at 10 km/s.
Figure 1 shows the initial conditions of the simulations. Two turbulent spherical clouds with radii of 20 pc are placed close together with a uniform magnetic field angled 60° relative to the x axis. In the colliding run, a relative velocity of 10 km/s is given to the clouds. A non-colliding control run is given no initial velocity besides the initial turbulence. By comparing the results of the two runs, the authors examine the physical properties of the clouds that result from such a collision.
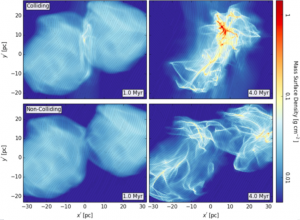
Figure 2. Surface gas density snapshots of the colliding (upper) and the non-colliding (lower) run at 1 and 4 million years. Grey streamlines denote the orientations of the magnetic field lines.
Figure 2 compares the snapshots of gas surface density at two different times for the colliding (upper panel) and the non-colliding (lower panel) run. The filamentary structures observed early on arise from initial turbulence. High-density structures develop faster and are more compact in the colliding case.
The main finding of the paper is that gas filaments and magnetic fields are more parallel to each other after cloud collisions and more perpendicular without collisions. The orientations of filaments and magnetic fields may therefore be used to test whether a cloud has experienced collisions.
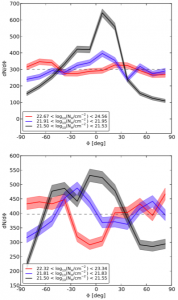
Figure 3. The Histogram of Relative Orientations (HROs) for the colliding (upper) and the non-colliding (lower) run. The colors black, blue, and red correspond to the low, intermediate, and high density gas. The angle Φ represents the angle between the magnetic field lines and the gas filaments.
To quantify their finding, the authors make use of the Histogram of Relative Orientations (HROs). Figure 3 shows the HROs for the colliding (upper) and the non-colliding (lower) run. A value of Φ = 0° means aligned gas filaments and magnetic fields, while Φ = ±90° means they are perpendicular to each other. The black, blue, and red curves show the relative amount of gas with different Φ at low, medium, and high density. In both colliding and non-colliding case, the low-density gas mostly has parallel alignments (peaking at Φ = 0°). For the high-density gas, however, the non-colliding run has relatively more contributions near Φ = ±90°. This distinction may serve as an observational test for gas cloud collisions. In their upcoming paper, the authors will simulate the star formation resulting from such collisions. Stay tuned!
Author
Trackbacks/Pingbacks