Title: Paperscape
Authors: Damien George and Rob Knegjens
First author’s institution: Department of Applied Mathematics and Theoretical Physics, University of Cambridge, UK
Status: Website with accompanying explanatory blog post [open access]
The nice thing about studying the Kepler exoplanets, as I do, is that they’re more or less all in one place. Sometimes I go outside and look up at them, or, more accurately, the place I know them to be: all 5000 or so, spilling off the edge of the Summer Triangle. The source of most of our knowledge of worlds beyond the solar system is neatly contained in that tiny patch of sky. Seeing it all at once makes me feel like someday I might understand it. (An added bonus is that if my research is going poorly, I can hold up my hand and pretend it’s not there.)
Today’s bite is for those of you who, like me, like to see everything all in one place. It’s not a paper this time–rather, it’s a map of papers, everything written and published on the arXiv since its founding in 1991. Behold: physics.
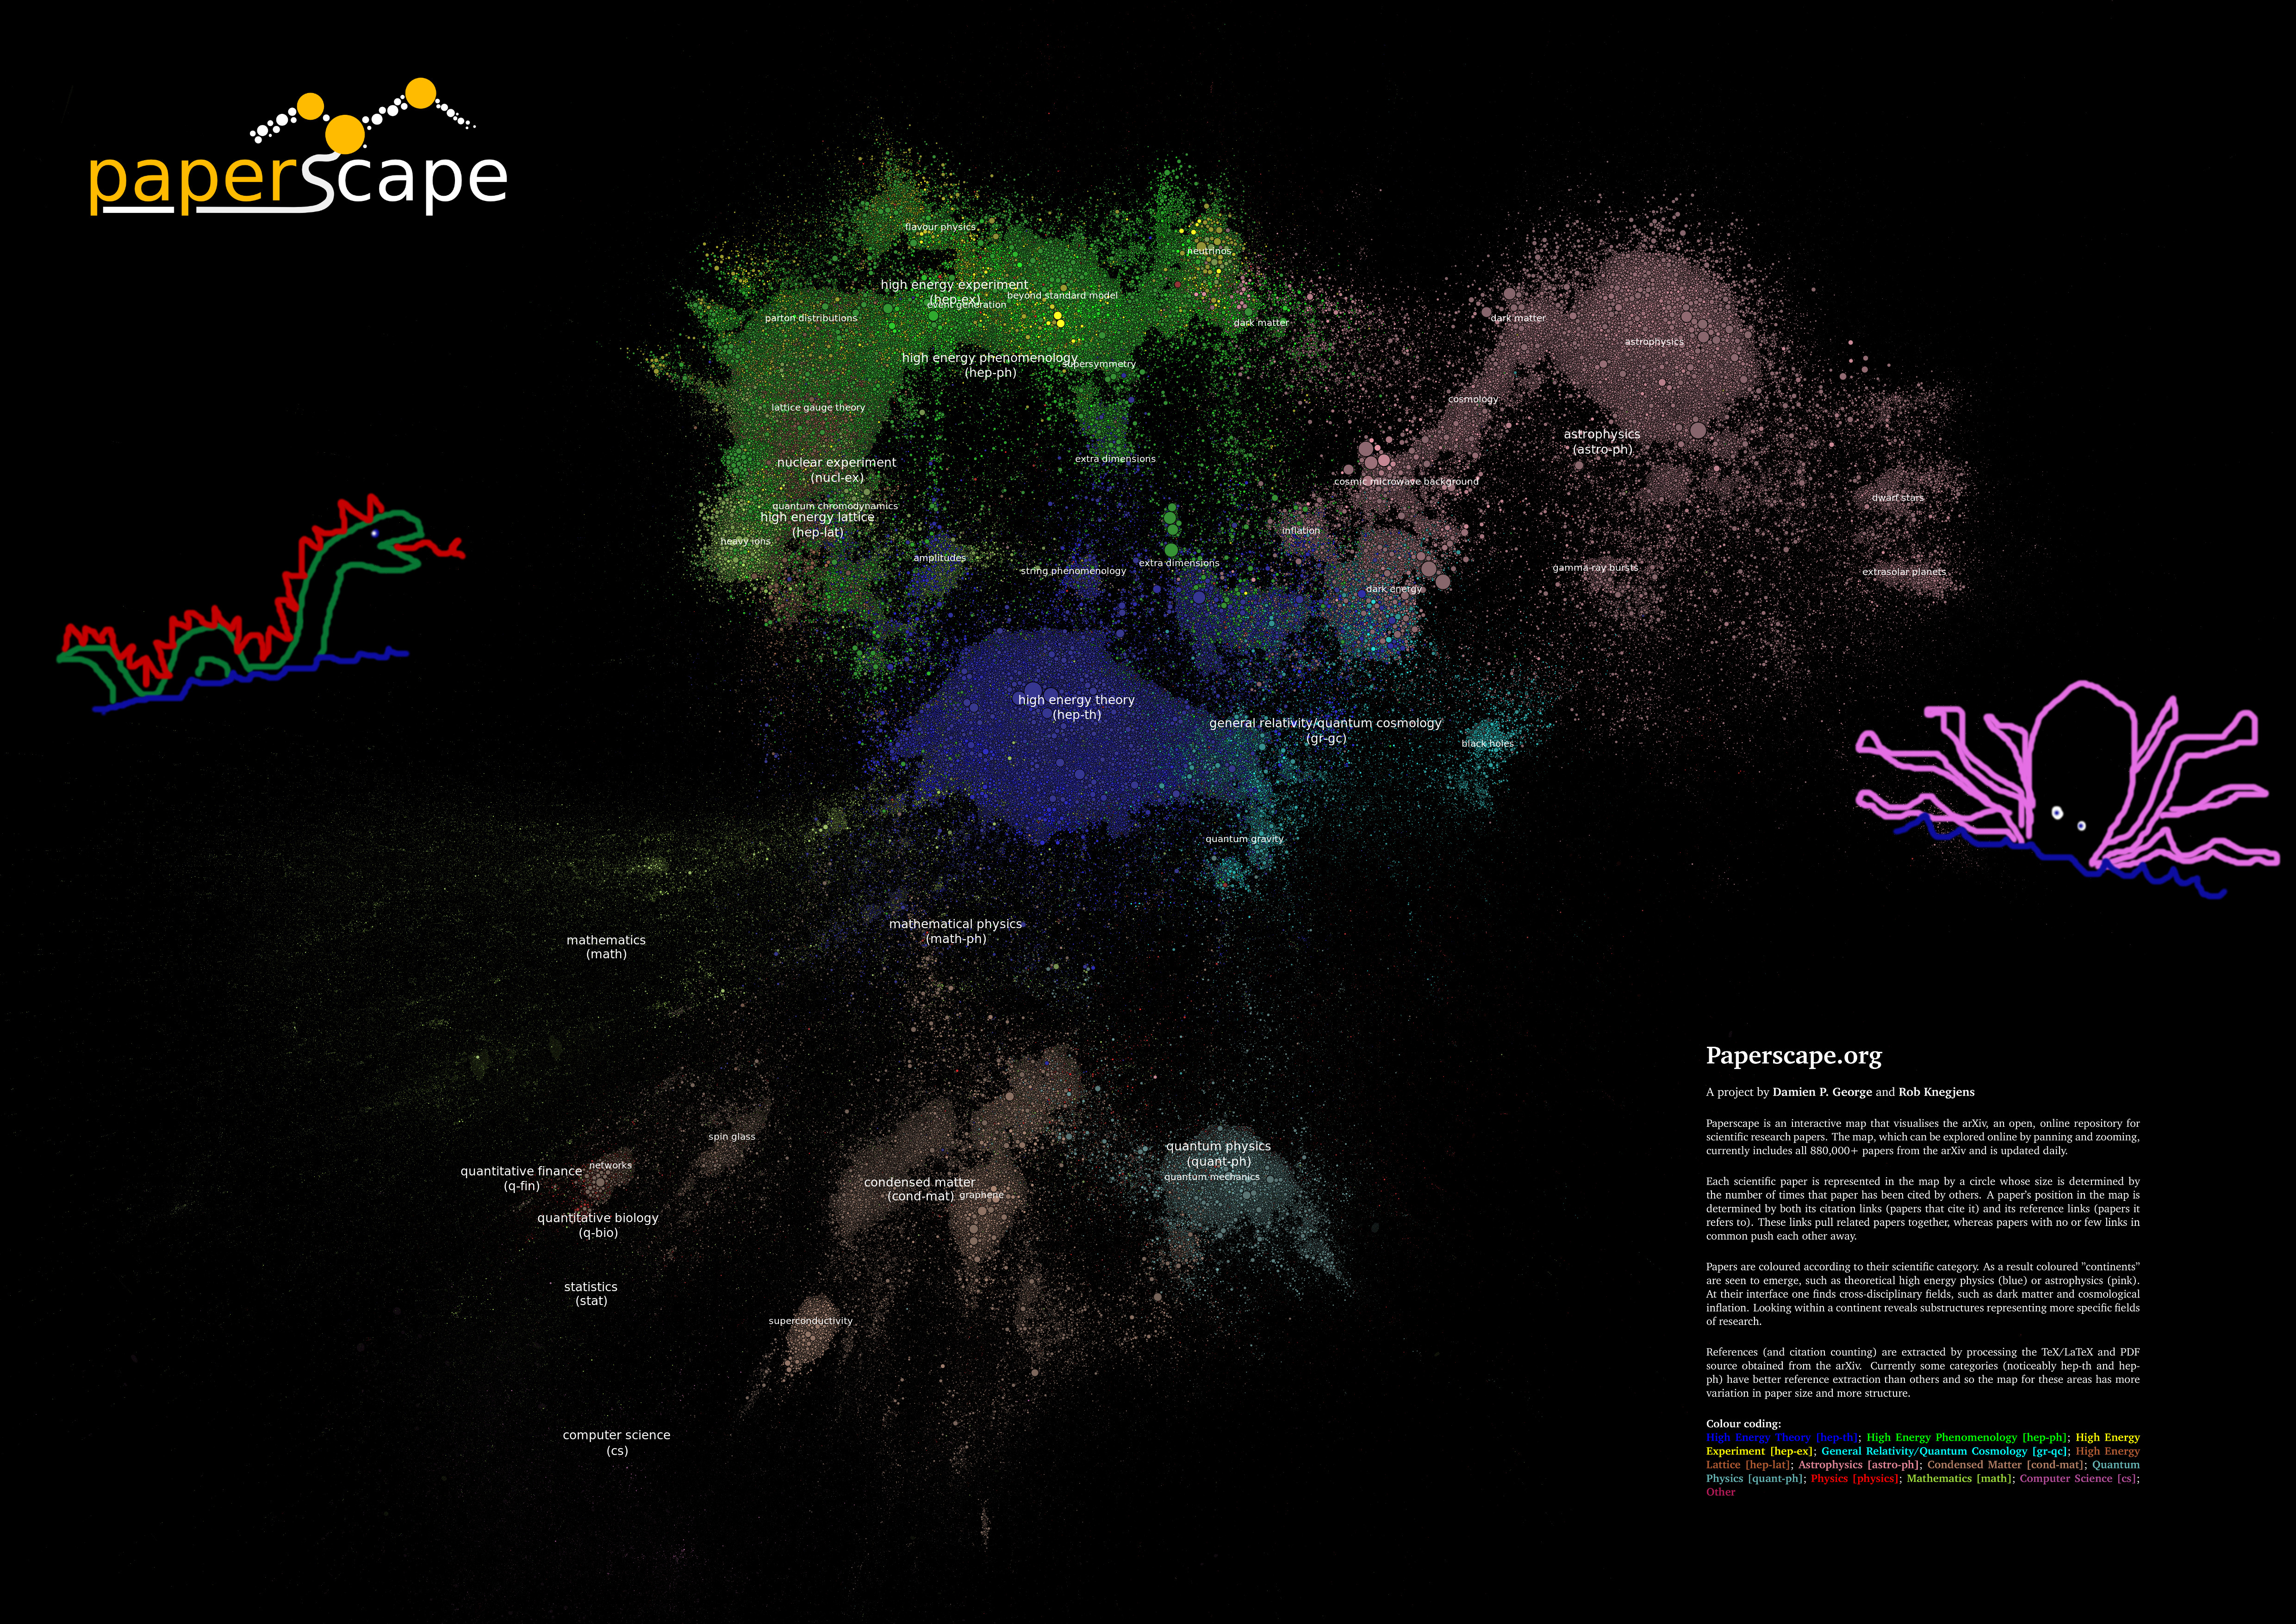
Figure 1. The arXiv landscape. Astronomy (pink, upper right) drifts in the vast sea of the unknown, among the continents of other physics sub-fields, beset by sea monsters that I in no way photoshopped in.
This map is called Paperscape, and each dot on it represents a single paper, color-coded by its subject matter and sized according to the number of other papers that cite it. Papers are grouped according to the other papers they reference–imagine a network of invisible springs holding like papers to like.
I could spend (read: have spent) hours exploring this landscape. The individual dots are themselves interesting, especially which papers are big enough to see from way above, like the Planck mission results or the NFW dark matter halo density profile. These are the landmark results of recent astronomical research. But more interesting is the arrangement: a vast continent of galaxies, giving way smoothly to a coastline of stellar populations, looking across a channel at an island of exoplanets. Southward, overlapping with the realm of quantum physics, an archipelago of black holes; westward, a cosmological isthmus.
I’m not sure I could describe to you exactly what I’ve learned from this map. I haven’t used it as a springboard to read the most highly-cited papers of the past 25 years, nor have I picked out and plotted smaller graphs of my own interests. But I feel that I understand astronomy somewhat better anyway, for having seen it all together. The field sprawls; it’s nice to keep it all in view.
Author
Trackbacks/Pingbacks