Title: Discriminating among theories of spiral structure using Gaia DR2
Authors: J. A. Sellwood, Wilma H. Trick, R. G. Carlberg, Johanna Coronado, and Hans-Walter Rix
First Author’s Institution: Steward Observatory, University of Arizona, Tucson AZ, USA
Status: Submitted to MNRAS, open access on arXiv
Spiral galaxies are named after their most prominent and stunning features – their spiral arms. These tightly wound filaments of stars and dust are undoubtedly one of the main reasons that pictures of spiral galaxies, originally taken for research purposes, often double as popular desktop backgrounds or as the centerfolds of coffee table books. Intuition correctly links the spiral structure to the rotational motion of these galaxies, yet the precise mechanism responsible for the formation of the spiral arms is still poorly understood. The goal of today’s paper is to improve on this picture by comparing maps generated from the second data release from the Gaia space telescope to simulations.

Figure 1. The Whirlpool Galaxy and its spectacular spiral arms (credit: NASA/ESA).
Several theories have been proposed to explain how spiral arms form. Perhaps the most intuitive of these — referred to as the material arm model — states that the spiral arms represent overdensities in the galaxy that have become wrapped around the galactic nucleus due to the galaxy’s rotation (see figure 2). A competing theory claims the spiral arms are transient features that result from the superposition of unstable density waves that cause stars to bunch up or scatter intermittently.
Unfortunately, studying actual spiral arms in order to test these theories is a tall task. Astronomers have traditionally relied on comparing galaxy simulations with observations of real spiral galaxies. But even this provides only an incomplete picture, due to the difficulty of analyzing the orbits of individual stars in the spiral arms, even in our own galaxy.
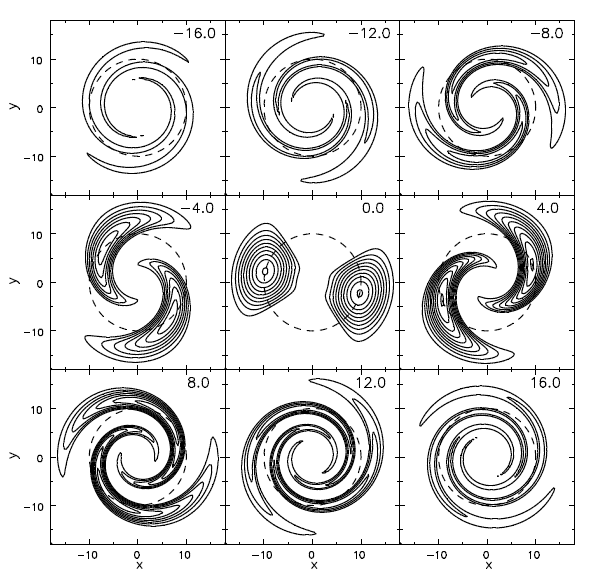
Figure 2. Contours of the potential in the material spiral arm model for a clockwise rotating galaxy. The time for each panel appears on the top right, and is given in dimensionless units related to the scale radius and velocity at 9 kiloparsecs (the distance marked by the dotted line in each panel). The negative times in the upper panels correspond to a counterclockwise rotating galaxy (Figure 9 in the paper).
All of this has changed since Gaia began its observation run. The European Space Agency’s space telescope has brought a revolution in galactic astrophysics, by providing accurate position and velocity data for about one billion stars in the Solar neighborhood. This incredible influx of data has allowed astronomers to perform unprecedented studies investigating the characteristics of our galaxy (e.g., see here, here, here, and here). Today’s paper takes advantage of this data to evaluate the various spiral arm theories.
The authors select a subset of stars from the Gaia dataset that are located in the Milky Way’s thin disk and are therefore expected to be better tracers of spiral substructure. To ensure high accuracy, they discard stars further than 200 parsecs from the Sun, after which they still end up with an impressive sample of over 300,000 stars, most of which have distances measured with uncertainties better than 1%. They then produce several maps of these stars, with various projections of their coordinates (see figure 3). To produce some of these maps, the authors use the stars’ positions and velocities to calculate their actions — quantities like angular momentum that remain constant over time and can therefore be used to define the complete path of an individual star’s orbit (as shown in the right-hand pane of figure 3). Action-space turns out to be particularly helpful for revealing the substructures that may be responsible for the spiral configuration of the galaxy.
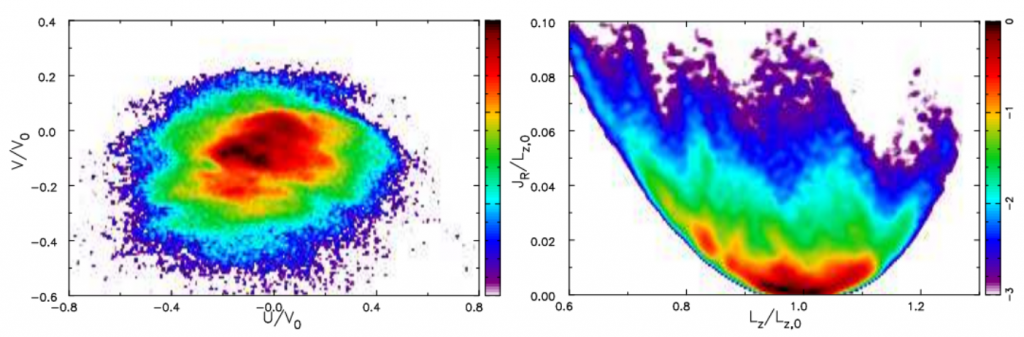
Figure 3. Two projections of the data of ~300,000 stars from Gaia. The left hand panel plots the density of stars in terms of their velocity components in the plane of the Milky Way’s disk (U and V), with respect to the Sun. The right hand panel plots the density in action space, with the z-component of angular momentum on the x-axis and the radial action (which is also a constant for each orbit) on the y-axis. Both axes are given with respect to the z-component of the Sun’s angular momentum. The substructure in both plots indicates departures from a smooth distribution function, such as overdensities that appear as spiral arms (Figure 3 in the paper).
Having mapped the actual data from Gaia, the authors next attempt to reproduce these maps using each of the proposed theories for the formation of the spiral arms. In each case, they begin with a smooth simulated distribution of stars and introduce a perturbation predicted by one of the theories they seek to test. They then produce similar maps from their simulations and compare them to the real data.
The left-hand panel of figure 4 shows the action-space projection for the transient mode model (in which the spiral arms are short-lived instabilities). The right hand panel of that figure shows the same projection for the real data from Gaia (same as the right-hand panel of figure 3), this time colored to highlight five features similar to the one predicted from the simulation. Additional similarities between this simulation and the Gaia data show up in other projections as well, suggesting that the transient mode model may indeed be the correct explanation for the Milky Way’s spiral arms. The simulations for the material arm theory do not match the data quite as well as the transient mode model, though the authors are not able to rule it out entirely. They also produce a similar simulation for a third model, known as the dressed mass clump model, and in this case they are able to rule it out due to the inconsistencies between the simulations and the real data.
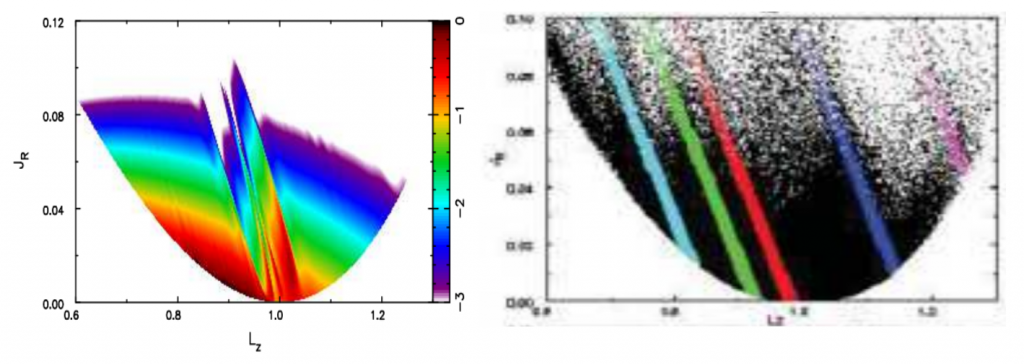
Figure 4. Comparison of a feature caused by the transient mode model (left panel) to the true distribution from Gaia (right panel), with similar features in the Gaia data highlighted in the right hand panel (Figures 7 and 13 in the paper).
So where does that leave us? The authors favor the transient arm model, arguing that the data seems to suggest that our galaxy’s spiral arms are short-lived features that appear and disappear intermittently. Though the current analysis isn’t entirely conclusive, and does not rule out all alternative theories, it nevertheless serves as a great demonstration of the benefits of maps in action space. It also serves as yet another reminder of the extraordinary amount of new science enabled by the second Gaia data release, which continues to inspire cutting edge research nearly a full half year after its release. Stay tuned!
Author
Trackbacks/Pingbacks