Title: On the patterns observed in Kepler multi-planet systems
Authors: Wei Zhu
First Author’s Institution: Canadian Institute for Theoretical Astrophysics, University of Toronto
Status: [Open access on arXiv]
If it weren’t for stars, we would know almost nothing about planets outside of the solar system. Nearly every trick that astronomers use for finding exoplanets involves carefully examining the way a distant planet alters the light from its host star. The 4000th exoplanet was discovered recently and, like the majority of known exoplanets, was found by watching the slight dimming of the host star’s light as the planet passed between us and it.
Unfortunately, this technique (known as the transit method) is biased. When you measure the amount of light blocked by a planet passing in front of a star, you can’t immediately determine the size of the planet. Instead, the temporary dimming of the star tells you the ratio between the size of the star and the size of the planet. Stars come in many different sizes, so a small planet orbiting a small star will produce the same transit signal as a large planet orbiting a large star. To make things even more complicated, starspots, flares and even inherent limitations of the instrument prevent you from seeing the dimming produced by the smallest planets.
These limitations become most apparent when astronomers search for trends and patterns between exoplanetary systems all across the sky. One of the more recently discovered trends has been dubbed ‘peas in a pod’. Adjacent planets that are orbiting the same host star seem to have similar sizes. This pattern has been observed across hundreds of planetary systems and is thought to be an important clue for understanding how planets form. The author of today’s paper argues that this apparent trend is nothing more than an artifact of our observational bias. In other words, if there were a magic telescope that could see and detect every single exoplanet, the ‘peas in a pod’ correlation would vanish.
A natural order?
To study this correlation in more detail, the authors examine the properties of 909 planets originally detected with the Kepler Space Telescope that were later followed up by the California Kepler Survey. The ‘peas in a pod’ claim was originally made by taking this same sample and showing that the radius of a planet and its outer adjacent neighbor are correlated. To prove that this trend was not an effect of observational bias, the radii of randomly selected nonadjacent planets were also compared and it was shown that there was no correlation. However, the author of today’s paper argues that this correlation should also emerge if the random pairs of planets selected are truly random.
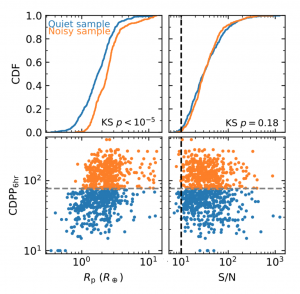
Figure 1: The distribution of transiting planet radii (left) and signal to noise ratio (right) for all planets in the sample. For demonstration purposes, the data are divided into two categories: noisy and quiet, which is defined by the size of the underlying short-term fluctuations in the brightness (CDPP) of the host star. CDF stands for cumulative distribution function, which is the probability that a planet in the sample has a radius less than the value given on the x-axis. The ‘KS p’ value in the top panel is the probability that the orange and blue distributions are drawn from the same underlying sample.
To understand why, we will first look at the radius and signal to noise distribution of these transiting planets, shown in Figure 1. Signal to noise measures the ratio between the underlying brightness variability of the host star and the change in brightness due to the transiting planet. The entire sample is divided into two pieces: a quiet sample, which corresponds to host stars with low noise, and a noisy sample, which corresponds to host stars with much greater brightness variability. The key point here is that cutting out noisy transits gives you a statistically different distribution of planet radii, while the distribution of signal to noise ratios of the transit events are unaffected. The ‘KS p’ number refers to the Kolmogrov-Smirnov probability, which represents the likelihood that two samples are drawn from the same underlying distribution. Notice that the planets around noisy stars are skewed towards larger radii. This is because it’s harder to detect a small planet around a noisy star because the transit signal gets buried in the underlying noise.
Choosing truly random pairs
In the previous study, the ‘peas in a pod’ trend was argued to be real due to the fact that there is a size correlation present between adjacent planets, but not between pairs of planets randomly selected by radius. However, Figure 1 shows us that the signal to noise ratio, not the planetary radius, is the fundamental quantity from which planets should be randomly selected. If pairs of planets are randomly selected according to the signal to noise distribution and the radius of the planet is then calculated from that S/N value (and the previously measured radius of the star), there appears to still be a correlation between pairs of radii. This is a clear indication that there is nothing special about the radii of adjacent pairs of planets. Figure 2 shows the radius correlation between adjacent pairs of planets (left), pairs of planets randomly selected by radius (middle) and pairs of planets randomly selected by S/N (right). As in Figure 1, orange points correspond to stars with more underlying noise. Because small planets are hard to detect around noisy stars, we should expect the orange points to lie toward the right side of the plot and blue points toward the left. This trend is not apparent when pairs of planets are randomly sampled by radius because the radius distribution is skewed towards larger planets (notice that the smaller planets are missing from the middle panel of Figure 2).
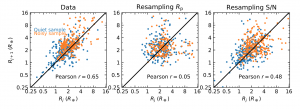
Figure 2: The correlation in radius between pairs of planets using three different sampling methods. The ‘Pearson r’ value denotes the strength of the correlation between the x and y values. The left plot shows adjacent pairs of planets that orbit the same host star. The middle plot shows pairs of planets randomly selected by radius. The right hand plot shows pairs of planets randomly selected by the S/N value of the transit. When drawing random pairs of planets by their signal to noise value, the radii appear to be correlated. The points are again divided into noisy and quiet categories.
A more intuitive way to think about the ‘peas in a pod’ trend is the following: if you are looking at a single star, your ability to detect planets is limited by the noise level of the star. If you find a large planet around a noisy star, you are unlikely to find a small planet accompanying it because the signal of the small planet’s transit might be too small to detect. This naturally leads to a size correlation because the smaller neighboring planets go undetected.
The moral of this story is that your data can mislead you. The limitations and inadequacies of our scientific tools can imprint themselves on our results in ways that even the most careful scientists can miss. As we work to understand the intrinsic medium from which we are drawing measurements, only careful scrutiny and skepticism will reveal the truth.
Author