Jen Locke is a sophomore studying physics at the University of Pennsylvania. She conducts her research at Penn under her advisor Dr. Masao Sako. She has presented her research at multiple conferences, including the 235th AAS Meeting in Hawaii and the American Physical Society New England Meeting in Rhode Island.
Unlike our Sun, which emits an almost constant level of light, the amount of light from variable stars significantly changes in repeated patterns. Monitoring variable objects can be very helpful in astronomy. Quasars (extremely luminous active galactic nuclei) are used to probe galaxy evolution and map black hole growth for observational cosmology. RR Lyrae variable stars enable us to find new low-luminosity dwarf satellite galaxies in the Milky Way.
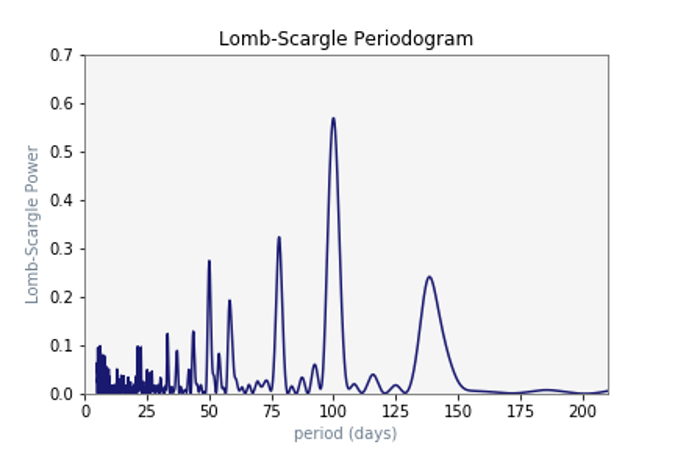
We can identify variable stars by observing how their light changes periodically over time. Initially, finding the period of the star is a really good indicator of what type of variable star it could be. However, the Legacy Survey of Space and Time (LSST, previously known as the Large Synoptic Survey Telescope) will collect large amounts of data, observing a third of the sky in only one night: it is much less time consuming to identify variable stars automatically. We want to implement an algorithm to quickly identify variable stars which could help LSST to discover new objects and identify those already known when it starts observing in the early 2020s. In advance of LSST opening we are developing this algorithm using Dark Energy Survey data as it often samples data unevenly in time. For variable stars like RR Lyrae, with periods of less than a day, an uneven sampling with several days between each data point can make it extremely difficult for any algorithm to identify RR Lyrae, so we need to test the algorithm’s reliability. The Lomb Scargle algorithm tests many different periods. For each period, lomb scargle ‘folds’ the data so all data points are within one period. It then calculates the “power” or likeliness that that period matches the given data. The algorithm outputs a graph of “period vs. power”, with the highest harmonic indicating the most likely period for that source.
We aim to implement an algorithm that will create a catalog and build statistical samples of different types of variable stars in Dark Energy Survey data. To do that, we need to figure out the best method of implementation to find the period, color, and other important features of stars with minimal computational costs in order to categorize them. We are currently trying to find the best method through testing simulations of real data and fine tuning the algorithm based on the results.
If you are an undergraduate that took part in an REU this summer and would like to share your research on Astrobites, please contact us at [email protected]!