Title: Winds in Star Clusters Drive Kolmogorov Turbulence
Authors: Monica Gallegos-Garcia, Blakesley Burkhart, Anna Rosen, Jill P. Naiman, and Enrico Ramirez-Ruiz
First Author’s Institution: Department of Physics and Astronomy & CIERA, Northwestern University
Status: Submitted to in ApJL [open access]
Turbulence, or chaotic changes in the pressure and velocity of a fluid, is one of the great mysteries of classical physics. Much of the gas in galaxies is known to be turbulent, but the mechanisms that developed and maintain this turbulence remain areas of active research. While we still don’t know all the details of the physics behind turbulence, a lot of time and effort has gone into identifying statistics that can tell us whether gas is turbulent or not. In other words, we know what turbulence looks like even if we don’t know all the details of how it works (see this Youtube video for a great introduction to turbulence and the power spectrum, a statistic used in today’s paper). Today’s weather forecast calls for strong winds blowing in from the arXiv as we explore a new paper studying how stellar winds from star clusters can drive such turbulence.
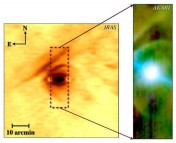
Stellar winds, particularly those from massive stars like O or B types, blow bubbles in the surrounding cold gas by pushing it outwards and leaving a cavity behind. These are analogous to the bubbles we see on Earth that are created by air pushing into some other medium. In the case of a stellar-wind bubble, the “air” is hot stellar wind material. When massive stars are found in a star cluster, their bubbles tend to overlap and form a “superbubble”. One incredible example of this is the Orion Nebula Cluster (Fig 1). The authors of today’s paper run simulations that roughly mimic the stellar profile of the Orion Nebula Cluster, and they too find the creation of large superbubble.
Figure 1: Observations of the Orion Nebula Cluster. The central stars can be seen in the bright cluster near the center of the image. A “superbubble” of gas has been produced by stellar feedback. From VLT Survey Telescope.
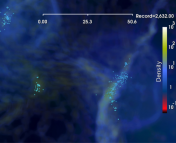
In these simulations, the most massive stars expel high-velocity, hot gas that fills the superbubble and pushes it outwards into cooler gas. This expansion produces a thick shell at an intermediate temperature (Fig 2). Because this shell is more dense than the central hot gas, it is able to cool faster and remain much cooler than the superbubble interior. As the simulations progress, turbulent instabilities appear in the hot gas inside the shell.
Figure 2: Plots of the expanding superbubble created by winds from massive stars. The most massive stars are shown in blue and purple, and these are the ones that primarily contribute to the bubble expansion. Top: Density slice, with high-density material shown in darker colors and low-density material shown in lighter colors. Bottom: Temperature slice, with hotter material shown in lighter colors and cooler material shown in darker colors. Time is shown in kyr (1 kyr = 1,000 years). Figure 1 in the paper.
One interesting result of these simulations is the diversity in speeds at which the gas is traveling. Figure 3 shows plots of the Mach number of the gas, a measure of how quickly gas is traveling relative to the sound speed of the gas. This is the same Mach number that is used to discuss very fast cars or planes — anything traveling at a speed greater than Mach one will result in a supersonic shock. In this case, the shell of the bubble is traveling at a Mach number greater than one as a supersonic shock that pushes into the surrounding material. However, Figure 3 also demonstrates that interior gas is almost entirely subsonic and subject to strong fluctuations in velocity throughout the bubble. In other words, even though the stellar winds drive a supersonic shock, they produce subsonic turbulence inside the bubble.
Figure 3: Plots of gas velocities in the expanding superbubble. The mass of the stars is denoted the same way as before. The Mach number is shown as a logarithm, meaning that negative numbers correspond to a Mach number less than one, zero corresponds to a Mach number of one, and positive numbers correspond to a Mach number greater than one. Time is shown in kyr (1 kyr = 1,000 years). Figure 2 in the paper.
In order to ensure that the hot gas inside the bubble is actually turbulent, the authors choose a statistic known as the power spectrum, which allows them to see how energy moves from large scales in the simulation down to small scales. Figure 4 shows the power spectrum at different times in the simulation. The typical expected power spectrum for subsonic turbulence is a power law with a slope of -5/3 (known as Kolmogorov turbulence). The authors find that their simulation roughly approaches this as time evolves, indicating that stellar winds are in fact driving primarily subsonic turbulence.
Figure 4: Density-weighted velocity power spectrum for different times in the simulation. The dashed line indicates the expectation for subsonic turbulence. The y-axis shows the power spectrum, and the x-axis denotes the wavenumber. See this video for an explanation of the power spectrum. Figure 4 in the paper.
This is an exciting result that indicates star clusters may have a significant role to play in driving and maintaining turbulence in galaxies. Modeling turbulence is crucial to understanding many processes in galaxy evolution, such as star formation. Through simulations like these, astronomers can get a better idea of exactly why gas in galaxies behaves the way it does and how it can form new stars, solar systems, and even us.


