Title: Galactic Spiral Structure revealed by Gaia EDR3
Authors: E. Poggio, R. Drimmel, T. Cantat-Gaudin, P. Ramos, V. Ripepi, E. Zari, R. Andrae, R. Blomme, L. Chemin, G. Clementini, F. Figueras, M. Fouesneau, Y. Frémat, A. Lobel, D. J. Marshall, T. Muraveva, and M. Romero-Gómez
First Author’s Institution: Université Côte d’Azur, Observatoire de la Côte d’Azur, CNRS, Laboratoire Lagrange, France
Status: Submitted to Astronomy & Astrophysics [open access]
agdgskdfjgdskrjgablekrug
afgjhabsdfkuaglseivblsdkfbsgfkjbdfglkajdbfgasdkf.jgb a.dskgb
Try picturing a bird’s-eye view of our own Galaxy in your head.
What does it look like?
Chances are, something like this – a big, beautiful, mostly blue spiral galaxy:
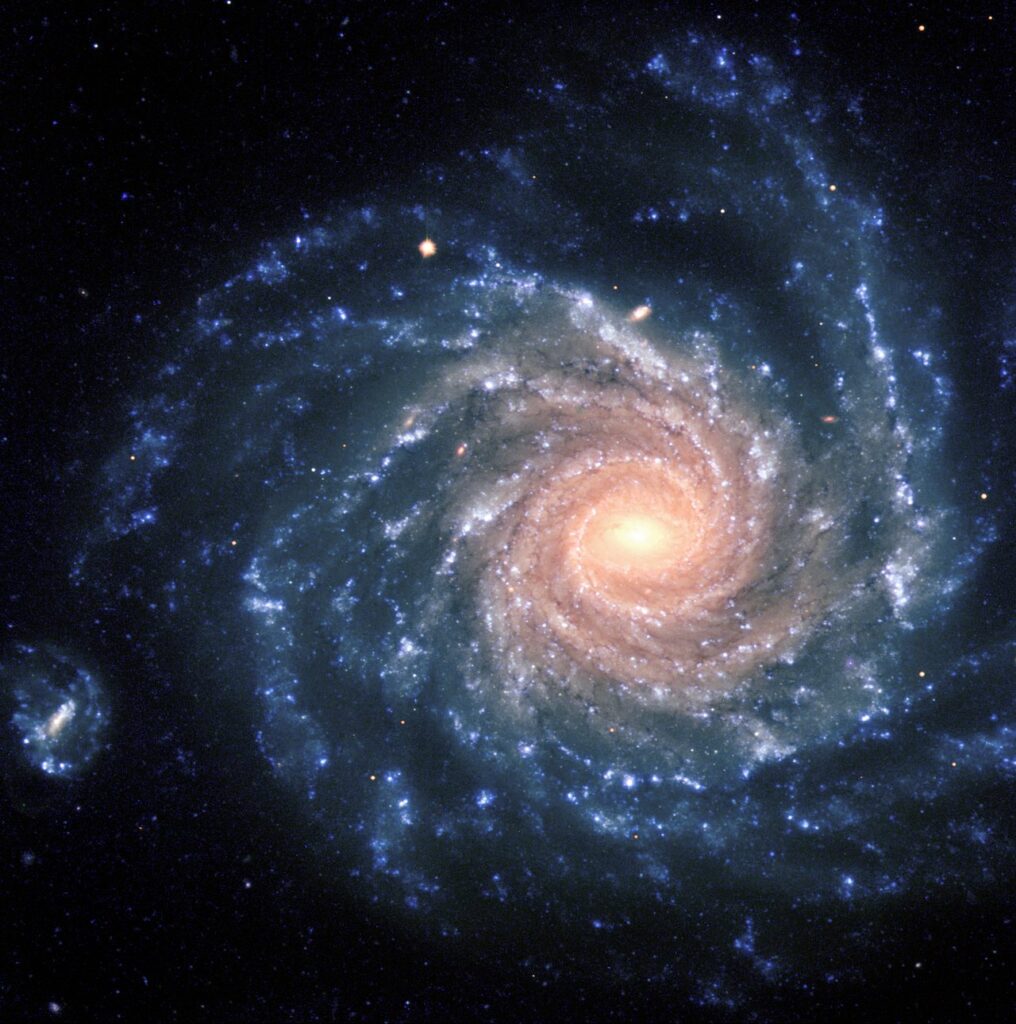
Figure 1: Spiral galaxy NGC 1232. Source: https://www.eso.org/public/images/eso9845d/
Although astronomers are confident that our own Milky Way is also a spiral galaxy similar to the one shown above, there are still many aspects of its structure that we do not fully understand. Spiral galaxies come in different types, including: grand design, flocculent, barred, unbarred, intermediate – all differing in the shape, number, size, and distribution of their spiral arms! Based on decades of observational studies, we believe that the Milky Way is a barred spiral. However, it is challenging to obtain a comprehensive picture of its morphology (shape and properties), since all our observations are taken from within our Galaxy itself!
Most previous studies agree on the number of spiral arms in our Galaxy, but there exists considerable debate regarding the positions, shapes, and pitch angles (a measure of how tightly wound they are) of these arms. For a non-exhaustive list of other papers focused on our Galaxy’s structure and its spiral arms, see other astrobites here, here, and here.
Today’s paper attempts to leverage an extremely powerful observational dataset to shed more light on this puzzle of these spiral arms! Using astrometric data from the Gaia mission, specifically its third Early Data Release (EDR3), the authors mapped the distribution of stars in a large part of the Milky Way, seeking to better constrain the properties of some of its spiral arms. From the Gaia EDR3 dataset, they selected three distinct samples to be used for mapping – approximately 1 million young upper main sequence stars (spectral types O, B, and A on the HR diagram), about 400 open clusters, and almost 3,000 classical Cepheid variable stars. All of these were chosen since they are relatively bright, and therefore their positions within the Galaxy are well constrained by Gaia data.
You might be wondering: what makes the Gaia data so powerful and useful for an analysis of this kind? The answer is: precision! Gaia was designed to provide the most accurate (by far) catalog of the positions and velocities of over a billion(!!!) stars in the Milky Way, at a level of precision that blew previous observations out of the water! Even with just its first three data releases, Gaia has completely revolutionised the study of our Galaxy, leading to groundbreaking discoveries related to hypervelocity stars, stellar streams, galactic dynamics, star clusters, and lots more.
The primary analysis in today’s paper involved using the samples from Gaia to map out the distributions of stars in a large section of the galaxy centred on the Sun. The authors were then able to identify over-dense and under-dense regions in the distributions, and correlate those to the presence of specific spiral arms. Figure 2 below shows the density distribution for the sample of young upper main sequence (UMS) stars, and one can make out that the distribution of stars is not at all symmetric or uniform around the Sun – in fact, the overdensities (in red) lie along specific “arches”, each of which corresponds to a known spiral arm of the Milky Way: from left to right – the Perseus arm, Local Arm, Sagittarius-Carina Arm, and Scutum Arm.
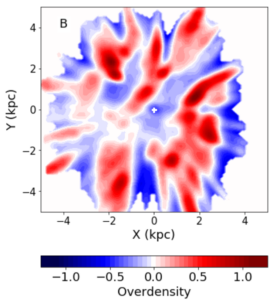
Figure 2: density map for upper main sequence stars (UMS) from Gaia, as seen in the plane of the Milky Way’s disk. Note that the white cross at the centre represents the position of the Sun, not the Galactic centre. There are four distinct overdense regions visible in the map – these are the “arches” corresponding to four specific spiral arms in the Galaxy. (Source: figure 1 in today’s paper)
In addition to the UMS sample, the authors also studied these density distributions in the open cluster and Cepheid variable samples, as independent tracers of the underlying spiral structure. The left hand panel of figure 3 below shows the density map for the UMS sample from figure 2, overplotted with the positions of the open clusters and a theoretical model for the spiral arms. As can be seen there, the distribution of overdensities is similar in the UMS and open cluster samples, and both agree reasonably well with the existing spiral arm model! This provides two independent constraints on the sizes, shapes, and number of spiral arms – at least for the four specific ones mentioned earlier.
Similarly, the right hand panel in figure 3 displayed the UMS density map overplotted with the positions of the Cepheid variable stars from their sample. Note that the Cepheid variables cover a much larger volume in 3D space than the other two samples, and show that the four identified spiral arms might continue on a larger scale than previously thought! You might also notice that the distribution of Cepheid’s doesn’t quite match with the UMS sample as well as the open clusters did – the authors explain this using the fact that the Cepheid stars are significantly older, and therefore more likely to have been dispersed over time by the Milky Way’s gravitational potential. When this effect is taken into account, they find that the Cepheid sample provides a third independent verification of their results for the four spiral arms, while also showing that their spatial extent is larger than that from previous studies.
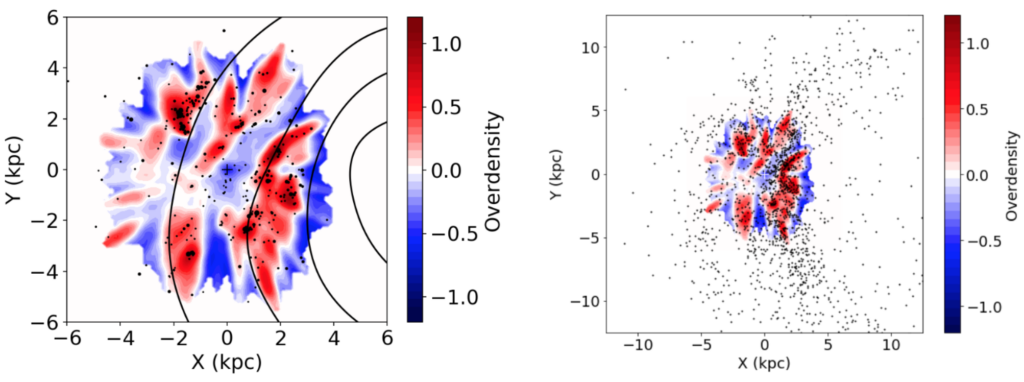
Figure 3: Left hand panel shows the UMS density distribution from figure 2, along with the distribution of open clusters (black dots) and a theoretical model of spiral arms from Taylor & Cordes 1993 (black lines). Right hand panel shows the original UMS density distribution with the overplotted distribution of Cepheid variable stars (black dots) in a more zoomed-out view. (Sources: figures 3 and 4 in today’s paper)
Overall, the paper successfully leverages the distribution of stars from Gaia’s exquisite EDR3 dataset to study the number, positions, and extents of our Galaxy’s spiral arms, and provides constraints on four of the known ones. They verify that the Perseus Arm agrees well with previous models, that the Scutum Arm is closer to the Sun than previously believed, and that some of the arms may extend further than previous studies show. Most importantly, upcoming data from Gaia promises to provide an even better picture of the Milky Way’s spiral structure, as positions and velocities of even fainter and further away stars get measured more precisely. In the era of Gaia, it’s an exciting time to be studying our own Galaxy!
Astrobite edited by Alex Gough
Featured image credit: ESA/NASA
Author