This Astrobite is based on a conference I attended from August 31-September 3 called The Audible Universe that worked to bring together sighted and visually impaired astronomers and sound experts to discuss the state of sonification in science.
Disclaimer: The author was involved in designing one of the tools, Afterglow Access, mentioned in this article.
Have a listen to the recording below:
What you just heard isn’t an airplane flying through the sky or a cat walking on a synthesizer keyboard, but the exoplanet Kepler-12b: a hot Jupiter orbiting extremely close to its host star. The sound begins at a slowly decreasing frequency, dips down to a noticeably lower frequency for a split second, then rises back up a little lower in frequency than before, repeating this trend for a few cycles. If you’ve ever learned about exoplanet science, you might be more familiar with a plot like the one below. It shows a lightcurve of the Kepler-12b’s host star as it orbits around. The star’s flux decreases every time the planet transits in front of the star.
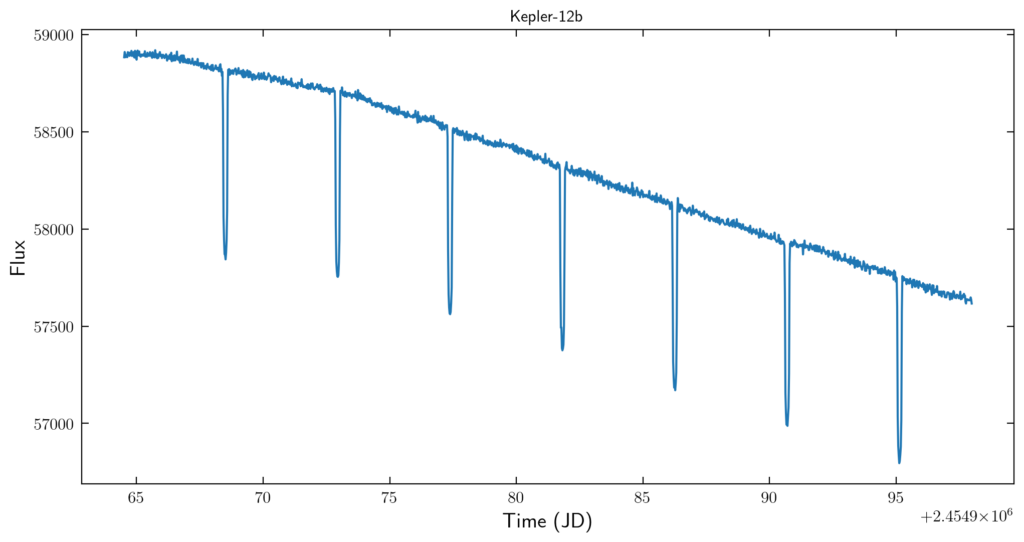
The dips in the lightcurve above can be heard in the recording as the short dips in frequency where the sound’s pitch decreases, and the overall downward trend of the curve can also be heard as the constant lowering of the sound’s overall frequency. The data showing how the flux of Kepler-12 changes as one of its exoplanets transits is the exact same in both cases, but encoded in two different ways.
Listening to Space: Challenging Perception
Astronomy is often referred to as a “gateway science”, partly due to its very visually-compelling nature. Those of us who are sighted might remember their first time being awed at seeing a high-resolution image of a galaxy or nebula from Hubble (and maybe using it to do a research project!) or even looking at a far-off star cluster through a telescope. But for an individual who is blind or visually impaired (BVI), it’s more of a “gatekeeper science”: even the luxury of understanding something as seemingly simple as the shape of different galaxies, let alone using astronomical data to do scientific analyses, is still highly inaccessible. Ironically, when people come up and ask if that famous NASA image of the Bullet Cluster is how the object actually looks, we realize that sighted individuals are also visually limited: humans can only see light whose wavelength is between ~400-700 nm–about 0.0035% of the entire electromagnetic spectrum!! Sadly, that gorgeous multicolor image stack of a galaxy cluster is not what you’d see while floating in space. So for generations, astronomers have taken light, from radio to gamma ray, and used computational aids to display it in the manner that made the most sense to them–visually–because it’s natural to those of us who perceive the majority of our world with our eyes.
But it doesn’t have to stay this way. After all, at its most basic level, the data that comes from our telescopes is nothing more than arrays of numbers! 1-dimensional data can just be a list of numbers over time or wavelength, such as a lightcurve or spectrum. 2D data like an image is simply the amount of light (whether visible or not) hitting a detector in different pixels. Therefore, we shouldn’t be limited to only displaying this data in one way.
And this challenge to the status quo of astronomical visualization is what led to the creation of last week’s virtual conference The Audible Universe. This event was dedicated to discussing the current state of the sonification of astronomical data, from current efforts and designing evaluation strategies for existing tools to future experiments and projects. Sonification might sound like a fancy term, but it’s really just the process of turning data into sound. You’ve probably heard of or even used devices that take advantage of sonification: Geiger counters, tuning forks, submarine sonar, even the “chirp” of invisible gravitational wave detections all rely on turning numerical data (like a person’s heartbeat) into something audible (beeps of an ECG). Now, a diverse group of both sighted and BVI astronomers, researchers, psycho-acoustic specialists, and educators are trying to put the sonification of astronomical data into the limelight and come together to share ideas, resources, and build a common ground for making sonification commonplace.
Pitch Perfect?
Participants in the conference spent four days immersing themselves in the evaluation and design of sonification tools. Before the event, leaders sent out pre-recorded videos on the use of sonification in outreach and education, an overview of 1D and 2D data in astronomy, and the perception of sound and acoustic design. This format was designed to provide all participants background on the aspects of sonification they might not be as familiar with. Being an astronomy graduate student, the videos about audio perception and design were quite eye-opening. I learned that because humans are naturally good at detecting variations in pitch, it is most commonly used to encode information (i.e. the lightcurve you heard earlier). Loudness, timbre (characteristic of the sound, like type of instrument used), duration, and spatial position can also be used to encode different parts of one’s data, with varying degrees of success.
That said, there are no international standards on how to use all these sound characteristics to best render different types of data (akin to “best plotting practices”) while also letting users customize their experience (akin to changing the colors or scaling on plots), which is one of the challenges researchers trying to create sonified resources have encountered. Participants also pointed out the necessity to be culturally inclusive in regards to designing sonifications: the majority of sonifications currently use predominantly Western instruments to convey sound. Our musical preferences are highly influenced by our culture, and what sounds pleasant to Western ears is not universal. We also need to be sensitive to different cultural perceptions of time, space, and sound–for example, while in English we say “the past is behind us”, some languages actually perceive the past as “in front of us”, which can affect how we sonify time series data.
A Sound Approach
The conference also introduced participants to different currently-available sonification tools that they evaluated, from browser-based tools to python packages. For example, SonoUno is both an application and web-based tool where you can import 1D data, such as a spectrum, and play through the data while marking important features you hear such as emission or absorption lines, saving the data afterward. You can also change the scaling or limits of the data you want to sonify such as the minimum/maximum volume, speed, specific audio qualities, or instrument used. In addition, the tool provides the ability to change the formatting of the plot displayed such as line color and style which enhances a multi-modal approach to analyzing data. Afterglow Access is another web-based image analysis software that sonifies a 2D image. It maps features on the left of the image to lower frequencies and on the right to higher ones, with background signal and nebulosity in the image represented as white noise. The user is also able to use keyboard commands to auditorily focus on different parts of an image depending on what features they want to examine. It also possible for BVI users to independently open images, navigate menus, and change sonification and image parameters. Finally, the tool I used to sonify Kepler 12b’s lightcurve is a python package called Astronify. With this tool, code-savvy users can download lightcurve data from Kepler or TESS (or simulate their own) and sonify the data (mapping pitch to flux) in one line. Astronify allows users to change sound parameters such as re-mapping the pitches, changing the scale from linear to logarithmic, removing data points, and saving the output sound.
While sonification can be a great tool for both teaching and data analysis, we must also remember that it’s best to allow for a multi-modal approach that empowers the user to choose how to work with their data. Combining sonification with both visual plots and tactile graphics is beneficial for everyone and can accommodate different learning styles of both sighted and BVI individuals. This is something participants acknowledged and even incorporated into their design ideas for a sonification project. For example, one of the groups thought about designing a sonified planetarium show using different sounds to represent walking on different planets and their atmospheres, adding a tactile museum display on the side to allow for both multi-modality and user interactivity.
Over the course of the week, participants came to terms with limitations of various softwares, thought about how to balance the need for standardization of sonification elements with allowing for customization of sound parameters, and initiated partnerships and future events that are paving the way for infusing sonification into classrooms, data archives, and coding tools. Hopefully in the coming decade, we’ll be able to reduce the barriers to participating in science for everyone and make astronomy a gateway for both sighted and BVI individuals to discover all that the universe has to offer us and make the stars sing 🎶.
Sample of sonified astronomy resources:
A4BD, Afterglow Access, Astronify, SonoUno, Universe of Sound, and this Astrobite covering a few sonification projects!
Astrobite edited by Catherine Manea
Featured image credit: Instagram/@nasahubble