Title: Reionization with Simba: How much does astrophysics matter in modeling cosmic reionization?
Authors: Sultan Hassan, Romeel Davé, Matthew McQuinn, Rachel S. Somerville, Laura C. Keating, Daniel Anglés-Alcázar, Francisco Villaescusa-Navarro, David N. Spergel
First Author’s Institution: Center for Computational Astrophysics, Flatiron Institute, 162 5th Ave, New York, NY 10010, USA
Status: Preprint on arXiv
While a tired trope to be sure, the hero’s journey to conquer the darkness and bring in an age of light is a memorable one. Today, our hero, cosmic reionization, isn’t a person, but succeeds in that illuminating quest all the same!
The authors of today’s paper consider one particular question: how do we model reionization? Namely, does the choice of modeling for ionizing photons sources (high-redshift stars and galaxies) impact observables on the large scales relevant for cosmological observations?
That’s a bit of a mouthful, but we’ll chew through it slowly and methodically in this bite!
Out of the darkness
Before we can talk about reionization, we have to understand what brought about the dark age of neutral hydrogen (HI) in the first place. Coming out of the hot big bang, the universe was initially fully ionized (all atoms were stripped of their electrons) up until it cooled to the point where hydrogen atoms “recombined” (free electrons paired up with lone protons) at a redshift of roughly 1000 (Fig. 1). After recombination, the universe was filled with neutral hydrogen, and was in a sense “dark”, since the cooling universe had no sources of ionizing photons to liberate electrons from the HI. However, during this dark age the seeds of revolution (ahem, structure formation) were slowly growing until eventually the first stars and galaxies formed inside dark matter halos, providing new sources of ionizing photons. These light-bringers then proceeded to make Swiss cheese out of the dark universe, creating the holes filled with ionized hydrogen (HII), which is illustrated by the bubbles at the center of Fig. 1. You can get an instant and visceral feel for this process by watching this wonderful movie of a simulation of reionization.
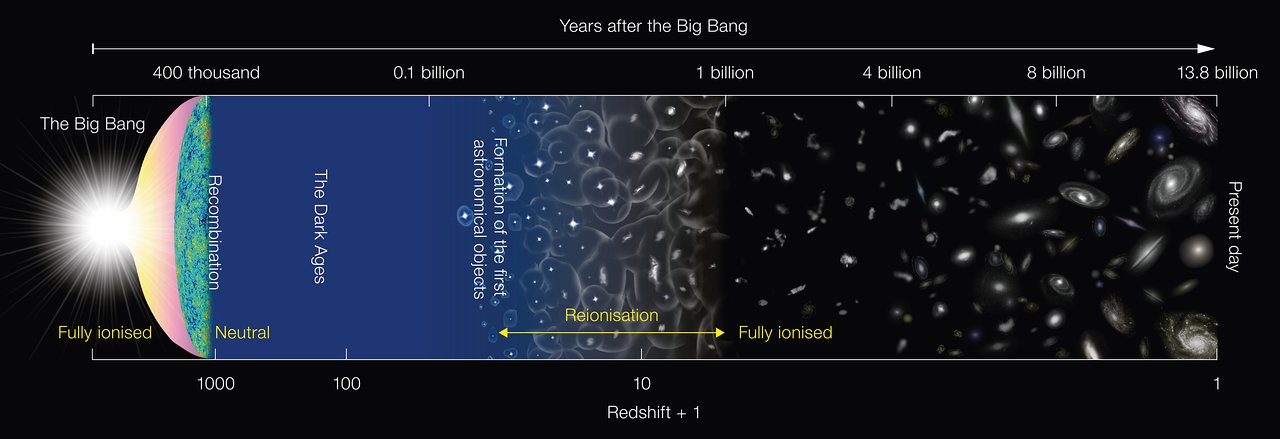
This diagram depicts the major milestones in the evolution of the Universe since the Big Bang, about 13.8 billion years ago. It is not to scale. The Universe was in a neutral state at 400 thousand years after the Big Bang and remained that way until light from the first generation of stars started to ionise the hydrogen. After several hundred million years, the gas in the Universe was completely ionised.
Figure 1: A schematic view of reionization within the larger cosmic timeline. Blue represents (opaque) neutral hydrogen, while black represents fully ionized hydrogen. The transition between these two regimes proceeds around redshift z = 10 by way of reionized bubbles around source stars and galaxies. Credit NAOJ.
This story, like many heroic journeys, neglects an enormous amount of real-world complexity. To accurately model reionization at the level necessary for upcoming surveys, astrophysicists need to answer a host of questions: What is the detailed morphology of reionization? How does reionization depend on the characteristics of large-scale structure? On the processes of galaxy formation? What about the nature of the ionizing sources? Today’s paper explores some of these questions using the SIMBA suite of galaxy-formation simulations, in particular, comparing different choices for the ionizing source modeling.
Getting straight to the source (modeling)
The question the authors set out to answer with the SIMBA simulations was whether or not the details of how stars and galaxies produce ionizing photons affect observables on large (“cosmological”) scales. To do this, they took the SIMBA simulations, which include a host of galaxy formation physics as well as gas hydrodynamics, and accounted for radiative transfer of photons in post-processing. Without getting too into the technical weeds, the specific comparison was whether it was possible to notice a difference in the morphology of reionization or in the spatial statistics of the ionized hydrogen distribution in the simulation with different choices of source modeling.The results of this comparison are shown in Figures 2-3, and we’ll walk through them one at a time.
Figure 2 shows the visual morphology of reionization by displaying the spatial distribution of the ionization fraction x_HII (blue is ionized, red is neutral) in the simulation. Each row of Fig. 2 corresponds to a different choice of source modeling (e.g. affecting photon escape fraction), and the columns correspond to increasing time (and therefore increasing mean global ionization fraction) from left to right. From a quick glance, it is clear that as we look down a single column, the Swiss chees-y structure of joined ionized bubbles looks broadly similar across source modeling choices. In particular, we notice that especially on large length scales, not much is changing, even though the smaller bubbles or detailed edge features may be changing significantly. The authors take this as a suggestion that source modeling choice doesn’t have a significant impact on large scales, but for a quantitative confirmation of this they turn to the power spectrum of ionized hydrogen, which describes the spatial distribution of HII.
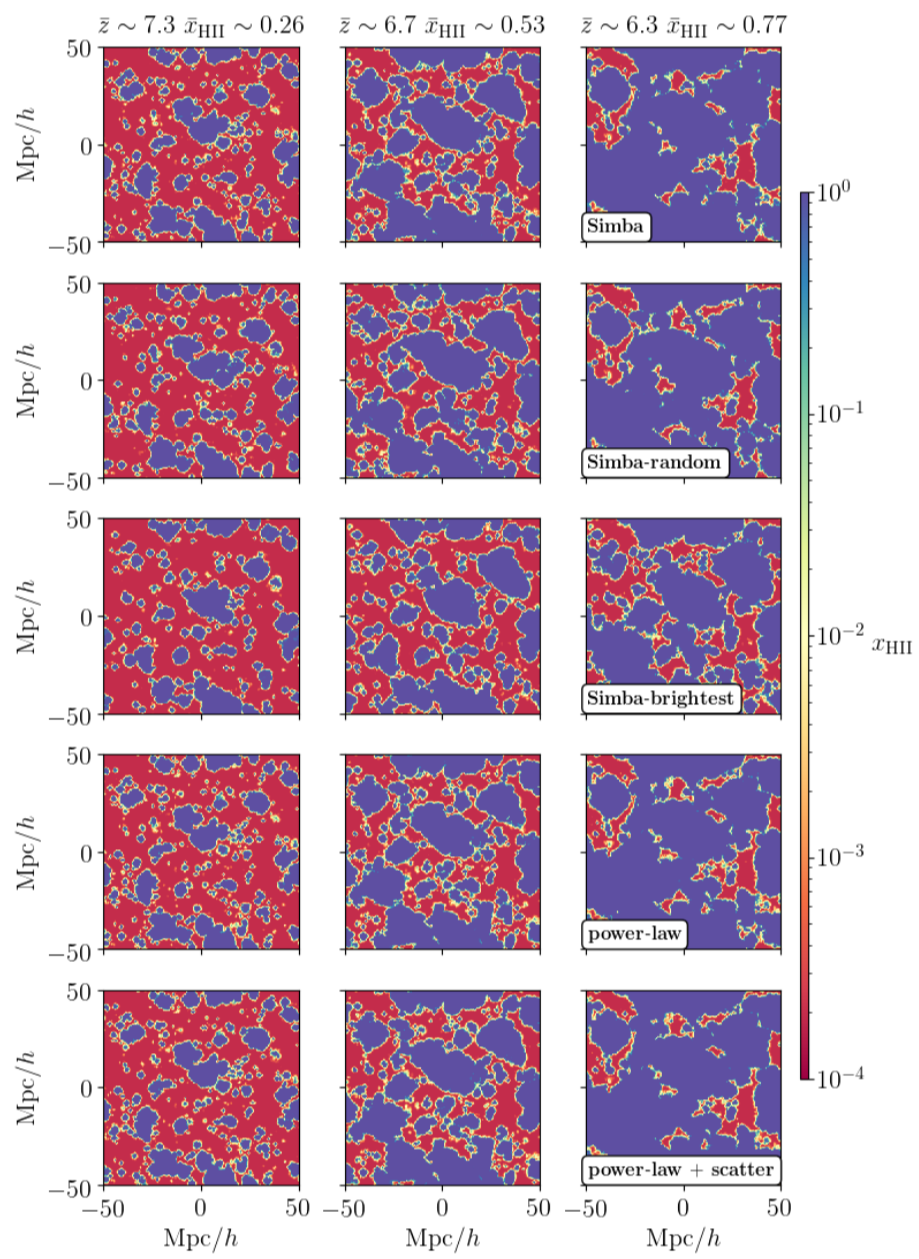
Figure 2: Simulation output maps of ionized hydrogen fraction (x_HII) as a function of time (left to right) for several choices of reionization source models (rows). Small features are different by eye in the different models but the overall morphology on larger scales remains the same. Figure 6 of today’s paper
Figure 3 shows the power spectrum of ionized hydrogen at the redshifts considered in Fig. 2, as well as their residuals in the lower panel. The different modeling choices correspond to the different curves in the Figure. The curves are broadly in agreement with each other over most scales for most choices of source modeling. In particular, on large scales (log k<0.0) the models agree quite well – quantitatively corroborating that the choice of source modeling used by the authors does not impact the large-scale spatial correlations of the ionized hydrogen.
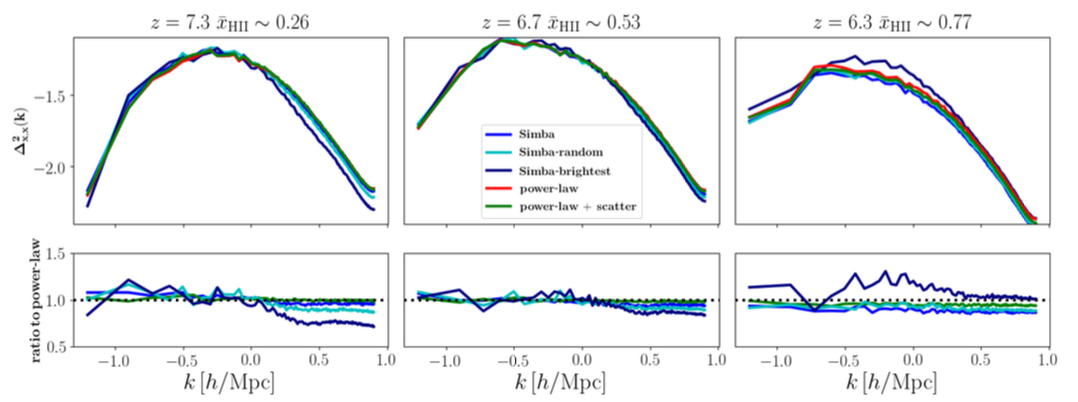
Figure 3: Reionization power spectra as reionization progresses in time from high to low redshift z (from left to right). For several choices of source modeling considered by today’s authors, the large-scale (low k) power is similar. Figure 7 of today’s paper.
The conclusion of this paper is concrete – the authors suggest that future large-scale reionization modeling can be accounted for by more efficient methods than expensive simulations like the ones included here. This follows from what we saw in the preceding sections – that changes in the source modeling and associated scatter in the ionization rate and halo mass relation does not affect large scales in Figures 6,7. If large-scale reionization does not depend on the details of astrophysical source modeling, this will definitely make the lives of astrophysicists studying large-scale reionization easier – without the need to simulate these details, many more less-costly simulations can can be run to extract information about the high-redshift universe on scales relevant for cosmology!
Edited by: Alice Curtin
Featured Image: Marcelo Alvarez, Tom Abel, Ralf Kaehler