Title: Across the Green Valley with HST grisms: colour evolution, crossing time-scales and the growth of the red sequence at z=1.0−1.8
Authors: Gaël Noirot, Marcin Sawicki, Roberto Abraham, Maruša Bradač, Kartheik Iyer, Thibaud Moutard, Camilla Pacifici, Swara Ravindranath, Chris J. Willott
First Author’s Institution: Institute for Computational Astrophysics and Department of Astronomy & Physics, Saint Mary’s University, Halifax, Canada
Status: Accepted to MNRAS
Not unlike Ellie in the Last of Us, many galaxies too walk through the valley of the shadow of death. While roughly half of the galaxies, including our own, are blue and actively star-forming, the other half are less lively. At some point in their lifetime, they stopped forming stars, or quenched, earning a grim label of “red-and-dead” galaxies. But how and when galaxies quench is still a million dollar question!
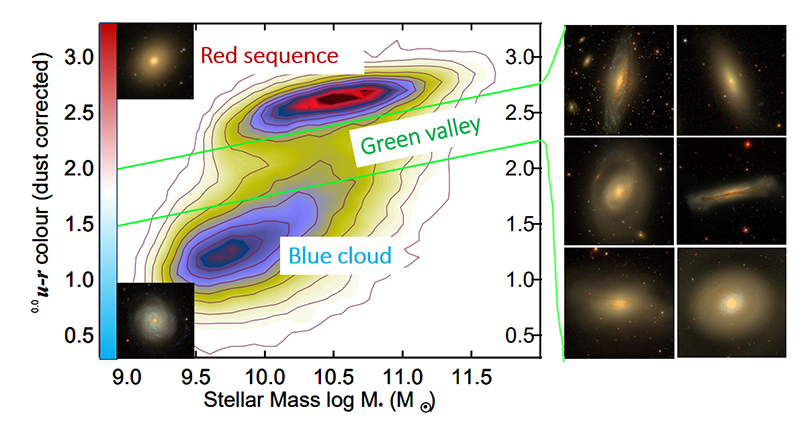
The authors of today’s paper study a relatively rare population of green valley galaxies in the early Universe, at redshift z=1-2, or 4-8 billion years ago. Green valley galaxies are dying, losing their star-formation-driven blue colors and becoming redder. The dearth of these intermediate-color galaxies (Fig. 1) tells us that the transition is rapid, and so this population of galaxies was romantically named the green valley.
The authors chose a particularly rich sample of galaxies from the GOODS-S and the UDS fields, that have been observed in a number of bands from the IR to the UV using Hubble Space Telescope, Spitzer, and many ground-based observatories. This rich dataset provided the authors with over 10,000 galaxies to study.
The bottom line of the green valley
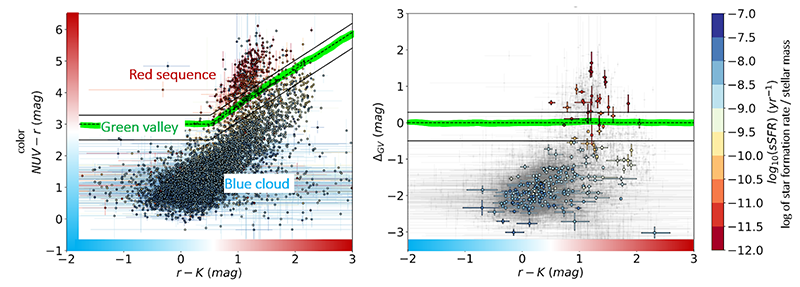
The authors of the paper were most interested in the speed of galaxies moving through the green valley from the blue cloud to the red sequence. To measure the transition along this space more easily, they defined the bottom of green valley (dashed line in Fig. 2, left) and transformed the diagram relatively to that line. This gave a new parameter: the distance to the bottom of the green valley, ΔGV, that all galaxies fall towards. The new parameter has several advantages: it is easier to calculate, to interpret, and it accounts for the loss of dust in spiral galaxies as they transition across the valley.
Winners and losers of the valley race
The authors then measured the star formation history of each galaxy. Most of their conclusions are made using a subsample of 265 objects that have grism (think grating+prism) spectroscopy, making the analysis of their star formation history more robust. They used a Flexible Stellar Population Synthesis method to estimate the star formation rate (SFR) of each galaxy as a function of time. This method lets scientists recover the time the galaxy first formed, and the SFR since then.
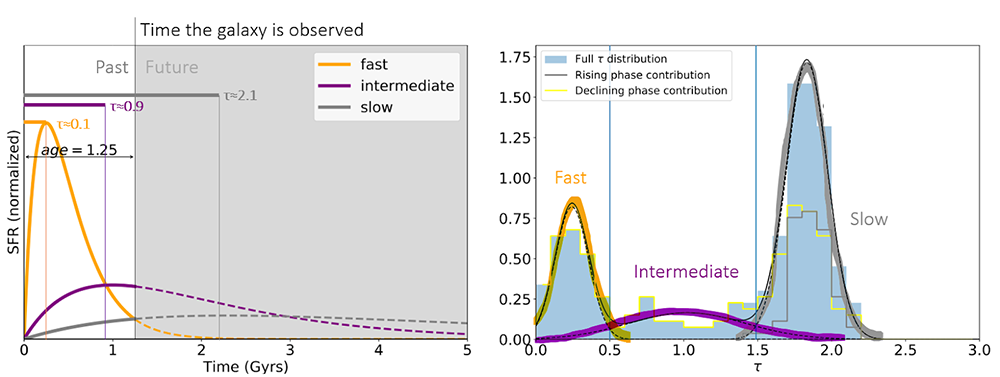
Fig. 3 shows examples of some star formation histories. Each line shows the SFR at different ages of a galaxy, from the time it was formed to the time it is observed. Gray shaded region shows the predicted future SFR. The authors use these curves to define a new parameter, τ, the time between galaxy formation and the peak of its star formation. Fast galaxies reach the peak and quench quickly after they form, intermediate ones peak after ~1 Gyr, and slow galaxies form stars for several Gyr before they peak. Keep in mind that galaxies in the sample may be very young, and their peak might be in the future! Fig. 3 (right) shows the distribution of the galaxies in their sample, and the clear division between fast, intermediate, and slow populations.
The race across the green valley
Of course, we can’t watch a single galaxy evolve across the green valley – it takes upwards of a billion years. But we can assume that galaxies from one group evolve similarly. Then fast galaxies that formed earlier are just a look in the future of the younger fast galaxies – the sample becomes a sort of a time machine!
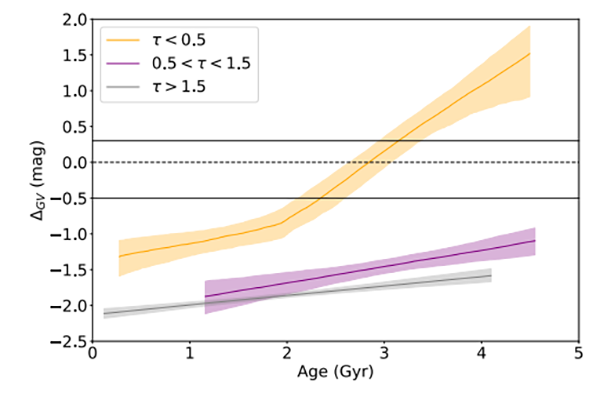
The authors plotted the ΔGV and measurements for fast, intermediate, and slow galaxies and looked at how long it takes a galaxy from each population to cross the green valley (Fig. 4). They found that while intermediate and slow galaxies basically never pass through the valley, fast galaxies quench extremely quickly – and reach the bottom of the green valley in ~1 Gyr!
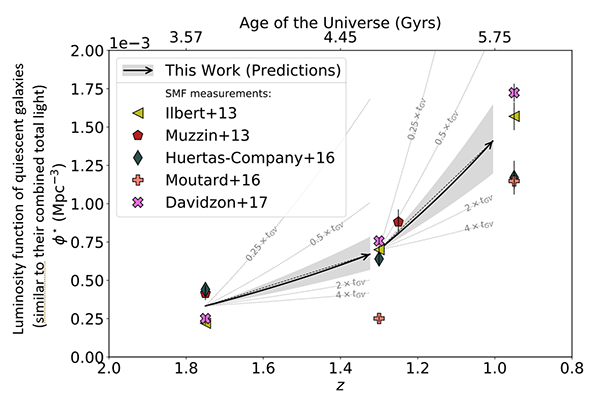
Using their results and the galaxy counts between redshifts 0.9 to 1.8, the authors took the time machine for a spin. They estimated how many of z=1.8 galaxies will become quenched by z=1.3, and how many of z=1.3 galaxies will quench by z=1 assuming the timescales they worked out. They then compared the actual number of “red-and-dead” galaxies at these times (Fig. 5). There is a remarkable agreement, and they successfully predicted the future!
The authors of today’s paper used a new method – looking at the time to reach the bottom of the green valley, and the delay between start and peak of star formation – to figure out how different galaxies cross the green valley. Turns out, only fast galaxies cross – or rather run – through. They start forming stars violently soon after birth, peak quickly, and then quench in less than 1 Gyr. Looking over a larger time frame, it’s the death of these galaxies that builds up the “red-and-dead” population over cosmic time. So if you are a galaxy and want to stay alive, slow and steady wins the race!
Edited by: Roan Haggar
Featured image credit: Green Valley in Krkonose by Roman Boed, CC 2.0 + Sloan Digital Sky Survey.