Title: Reassessing the Evidence for Time Variability in the Atmosphere of the Exoplanet HAT-P-7 b
Authors: Maura Lally, Andrew Vanderburg
First Author’s Institution: Cornell University NY, Northwestern University IL University of Texas at Austin TX, USA
Status: Published in The Astronomical Journal, open access
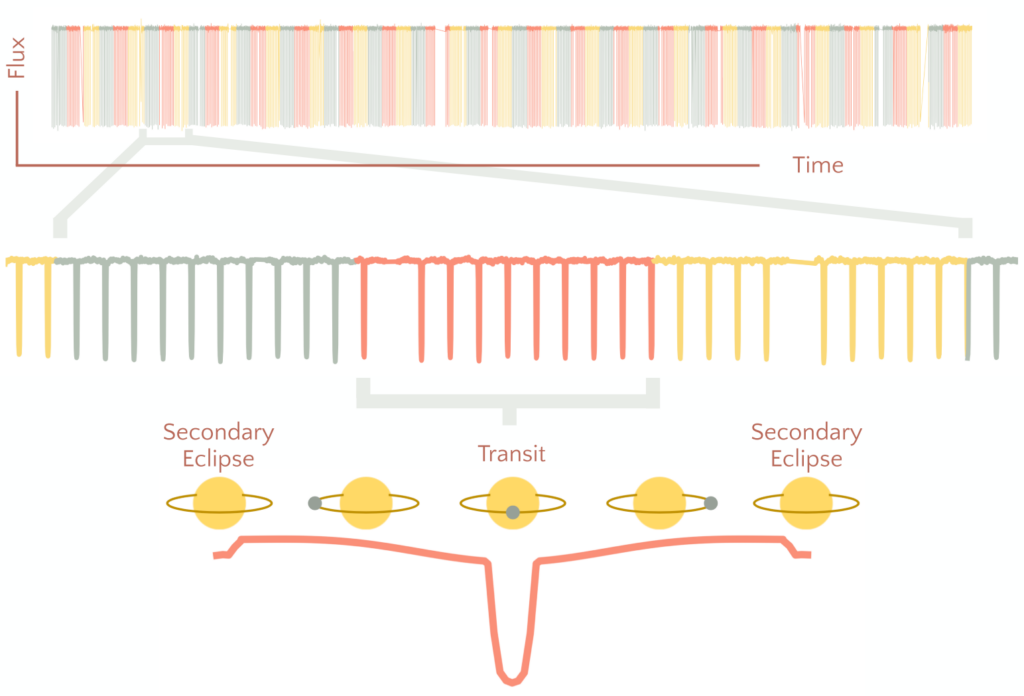
It would make sense, given the ever-changing atmospheres of Earth and the other solar system planets, that exoplanets would also be host to their own kinds of “weather”. But, despite the many characterised exoplanet atmospheres, confidently detecting a changing atmosphere remains extremely challenging. Previous attempts to assess the variability of exoplanet atmospheres have used phase curves – a measure of the changes in observed stellar flux over a planet’s entire orbit as it passes in front of and behind its star (see, for example, Figure 1). For tidally locked planets such as hot Jupiters, because different parts of the atmosphere will be visible as the planet moves around its star, the shape of the phase curve can provide information about the planet’s atmosphere. By monitoring how the phase curve varies over time, you can therefore decipher if the atmosphere is varying.
The first planet to be assessed in this way was HAT-P-7b, a hot Jupiter which was observed by the Kepler mission for over four years. The original study (Armstrong et al., 2016, which was covered by this Astrobite!) found that the hottest part of the planet’s atmosphere shifts east and west by up to 41 degrees in latitude away from the substellar point, likely thanks to strong but changing wind patterns. However, phase curve analysis is hard, especially if the host star itself is changing over time, and theoretical work has struggled to explain hotspot offsets as large as HAT-P-7b’s. The authors of today’s paper, therefore, take another look at the mysterious weather of HAT-P-7b.
Back to Basics
As an initial test, the authors first analysed the many phase curves in the original Kepler data to see if they obtained the same hotspot offset variability as Armstrong et al. To ensure that the result wasn’t influenced by any analysis choices, the authors repeated their methods on different outputs of the Kepler data reduction pipeline and tested different model choices to compare the results.
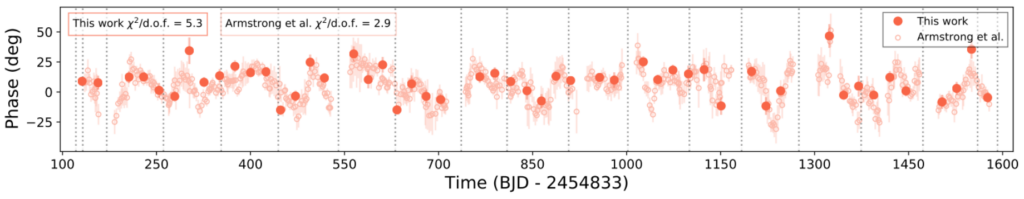
As seen in Figure 2, their offset measurements were comparable to those of Armstrong et al., although the offset was only seen to vary by up to 30 degrees, a result which was robust for all their analysis choices. But is this variability actually coming from the atmosphere? To determine if the host star could be causing the phase curves to vary, the authors injected simulated non-varying planetary phase curve signals into the light curves of a selection of stars similar to HAT-P-7 and extracted the resulting hotspot offsets. This test showed that similar variability could be recovered from the injected light curves, meaning that it’s possible that HAT-P-7b’s hotspot offset might not be varying after all! Given that Kepler was known to be a very well behaved instrument, the stars themselves must be varying and contributing additional noise to the phase curves.
Tuning Out The Noise
To understand what causes of noise might be impacting HAT-P-7b, the authors produced the power spectrum of the light curve of HAT-P-7. They then compared it to a white noise spectrum, as shown in Figure 3, to identify at what frequencies significant sources of noise were occurring.
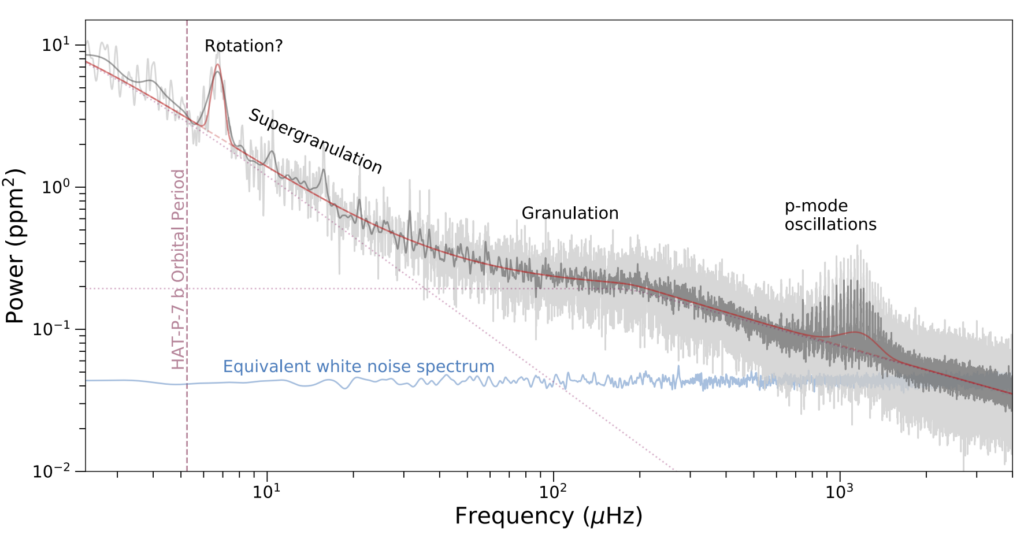
Figure 3 shows that HAT-P-7’s light curve has a significant amount of excess noise at timescales similar to the planetary period, which could explain the observed variations in the hotspot offset. Noise due to supergranulation, changes in stellar brightness as bright warm bubbles appear on the surface of the star over long timescales, is particularly dominant around the period of HAT-P-7b, and could very easily be affecting the hotspot offset measurements.
With all this evidence to hand, the authors conclude that the varying offset measurements of HAT-P-7b are likely not related to atmospheric variability and that supergranulation is the culprit of the changing phase curves. Although Kepler is now decommissioned, the analysis performed in today’s paper provides a helpful tool for verifying past and future claims of exoplanet weather from it or any other telescope, including JWST.
Astrobite edited by Yoni Brande
Featured image credit: Mark Garlick/University of Warwick / Shutterstock