Title:The progenitor galaxies of stellar halos as “failed” Milky Ways
Authors: Sownak Bose and Alis J. Deason
First author’s institution: Institute for Computational Cosmology, Department of Physics, Durham University, Durham DH1 3LE, UK
Status: available as an arXiv preprint; submitted to Monthly Notices of the Royal Astronomical Society (MNRAS)
Much like halos of light around the heads of religious and mythological figures, many galaxies too contain a large halo of stars surrounding their central regions – aptly named the stellar halo! They often extend far outside of a galaxy’s brightest and densest regions; galaxies like our own Milky Way have ones extending out to hundreds of kiloparsecs (for comparison, the radius of our Galaxy’s disk is roughly 15 kiloparsecs). Under our current models of galaxy formation, massive galaxies form through the mergers of lower-mass ones, and stellar halos are the remnants of destroyed lower-mass galaxies that merged into the more massive one, with stars from the merging systems thrown into giant, random orbits – creating a diffuse “halo” structure.
One Galaxy, Multiple Futures
Observations have shown that the predominant past merger events that led to the formation of our own Galaxy’s stellar halo involved galaxies like the Large Magellanic Cloud (LMC) (with stellar masses of roughly a billion Solar masses, as opposed to the Milky Way at roughly 10 billion Solar masses) falling into the proto-Milky Way, with the most significant of these being the Gaia-Enceladus Sausage. Since previous studies have shown that LMC-mass galaxies are the primary building blocks of our Galaxy’s stellar halo, the authors of today’s paper use simulations to study the evolution of LMC-mass galaxies from redshift z = 2 (roughly 10 billion years ago) to present day. In particular, they conduct a careful analysis of three possible fates of those galaxies:
(i) ones destroyed and end up in the stellar halos of Milky-Way mass galaxies
(ii) those that are the progenitors of galaxies like the Milky Way at present day, and
(iii) ones that survive to present day and end up forming galaxies like the LMC
In particular, they ask: are there any identifiable properties of LMC-mass galaxies (~ 10^9 Msun) at z = 2 that determine which of the three evolutionary pathways they will follow? Their study is also motivated by the related question: could multi-wavelength observations of such galaxies at z = 2 allow us to distinguish which ones will end up destroyed and in stellar halos, which ones will form Milky Way-like galaxies, and which ones will form LMC-like galaxies?
I SAM what I SAM
To investigate a statistical sample of galaxies and their evolutionary pathways, the authors turn to the theoretical astrophysicist’s favourite tool: simulations! Cosmological simulations rely on the use of supercomputers to model the growth of large-scale structure in the Universe, and statistical properties of large samples of galaxies (as an example, check out some fun videos of the EAGLE simulations here!). In particular, they rely on the dark matter-only Copernicus complexio Low Resolution or COLOR simulations (phew, talk about astronomers’ penchants for convoluted acronyms). These simulations allow them to build an accurate model of how the dark matter halos that galaxies inhabit merge and grow over time, thus dictating the mergers and evolution of the galaxies themselves. Note that dark matter halos are entirely distinct from stellar halos, and the important idea to remember is that most, if not all galaxies live within gigantic clumps of dark matter. For more on dark halos, see previous astrobites here and here.
But wait, there’s more! Since dark matter-only simulations would provide no information about stellar astrophysics and the formation ofstellar halos, the authors combine the simulations with a Semi-Analytic Model (SAM) called GALFORM. SAMs are a technique used to analytically (instead of numerically, like in simulations) model the stellar and gas physics of galaxies, and are often calibrated against observations. SAMs are a lot less computationally expensive than full simulations, and since stellar and gas physics is a lot more complex than that of dark matter, they allow for much faster modelling as opposed to relying on full-scale simulations. Since dark matter only obeys the laws of gravity and is computationally cheap to model, the authors rely on the combined tool of the dark matter-only COLOR simulations with the GALFORM semi-analytic model, to build up a large sample of roughly 17,000 LMC-mass galaxies at z = 2 and their evolutionary futures!
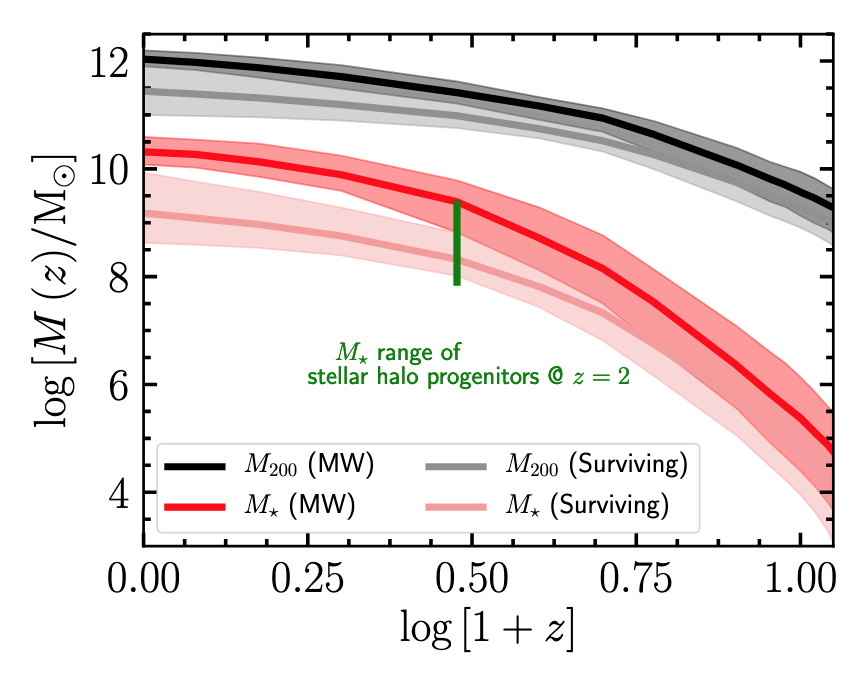
Figure 1 shows the mass growth history of the galaxies in their sample versus redshift (or cosmic time). In this figure, they show the masses of galaxies that survive to present day to form LMC analogues, compared to the masses of galaxies that end up being the main progenitors of Milky Way-like systems at present day. The red lines show stellar masses, and the black lines show dark matter masses (shown as M200) of the galaxies, with time moving from right to left.
The plot shows that although at early cosmic times (right hand side), the proto-Milky Ways and proto-LMCs have similar stellar and halo masses, their evolutionary pathways differ enough that by present day the galaxies that end up forming LMCs have almost an order of magnitude lower masses than those that end up forming Milky Ways! You might ask, what causes this difference? The answer is the third set of galaxies – the ones that are destroyed and end up falling into the stellar halos of the Milky Ways, which is why the Milky Ways end up with higher overall masses.
For galaxies as with real estate – it’s location, location, location!
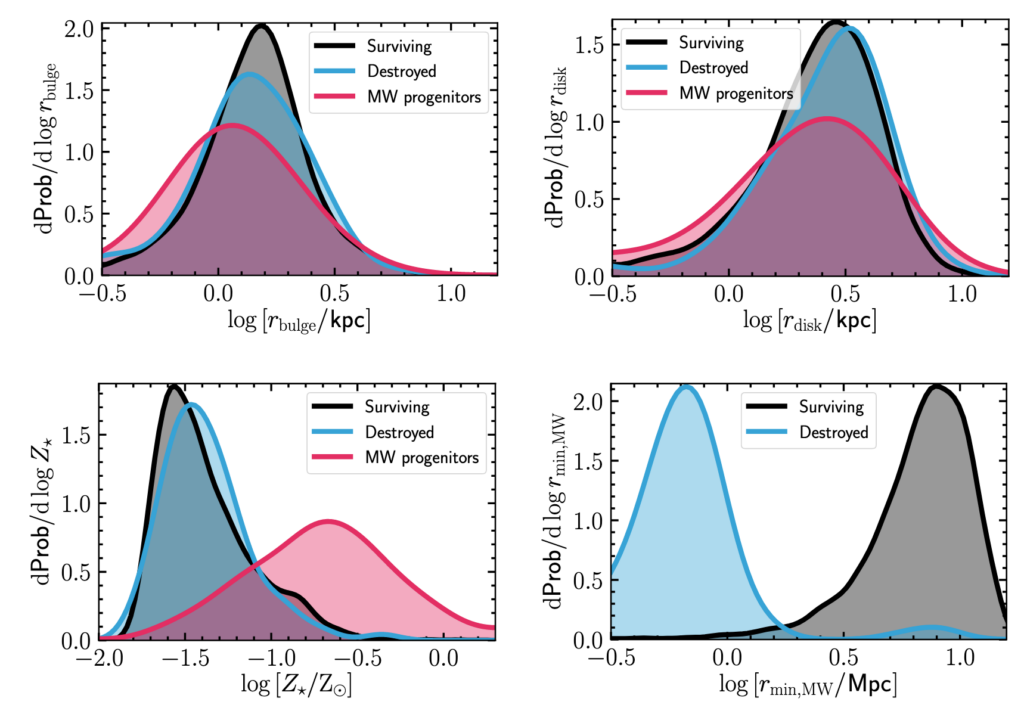
The question remains: if all of the galaxies at z = 2 are similar to each other (all at roughly 10^9 Solar masses), what exactly determines their overall end state: forming a Milky Way, forming an LMC, or ending up destroyed in the stellar halo of a Milky Way? The authors investigate numerous properties of the galaxies at z = 2 to figure out if any of them influence the outcome, and their results are potentially surprising: the only property that seems to matter is the galaxy’s location! That is, if the galaxy is close to a slightly more massive galaxy, then it’ll get destroyed by that more massive neighbour and end up in its stellar halo. The more massive neighbour will end up forming a Milky Way-like system! However, if a galaxy is far removed from any more massive ones, then it’ll continue surviving to the present day and end up forming an LMC-like galaxy.
Figure 2 shows exactly this. Each panel presents the probability distribution of various galaxy properties at z = 2: bulge size in the top left, disk size in the top right, chemical composition in the bottom left, and distance from a more massive neighbour in the bottom right. In each panel, the galaxies are split into the three samples: those that survive to present day as LMCs (“Surviving”), those that form Milky Ways at present day (“MW progenitors”), and those that are destroyed and end up in stellar halos of Milky Ways (“Destroyed”). The final panel does not show Milky Way progenitors because those are the reference galaxies from which the distances of the other two samples are calculated. As the top two and bottom left panels show, their bulge sizes, disk sizes, and chemical compositions of the “Surviving” and “Destroyed” samples are almost identical. The final panel shows that the “Destroyed” population is on average much closer to the Milky Way progenitors than the “Surviving” population, and this seems to be the only important parameter that determines the overall fate of a galaxy at z = 2.
The authors end by proposing that if we were to carry out a observational survey of such galaxies at z = 2, we would probably find examples of all three samples in the same regions, with their separations giving us insight into which ones would survive in the future and which ones would get destroyed, feeding the stellar halos of the others.
Astrobite edited by Maryum Sayeed
Featured image credit: Getty Images/iStock