
Authors: Sam E. Cutler, Luke Robbins, Danilo Marchesini, Katherine A. Suess, Adam Muzzin, Gabriel Brammer, Yoshihisa Asada, Nicholas S. Martis, Stacey Alberts, Jacqueline Antwi-Danso, Aidan P. Cloonan, Ivo Labbé, Tim B. Miller, Ikki Mitsuhashi, Alexandra Pope, Anna Sajina, Ghassan T. E. Sarrouh, Monu Sharma, Mauro Stefanon, Edgar P. Vidal, Chris J. Willot, Rachel Bezanson, Maruša Bradač, Olivia R. Cooper, Robert Feldmann, Ben Forrest, Karl Glazebrook, Jenny E. Greene, Valentina La Torre, Jamie Lin, Michael V. Maseda, Ian McConachie, Themiya Nananyakkara, Gaël Noirot, Richard Pan, Kesha A. Patel, Veronica Pratt, Marcin Sawicki, David J. Setton, John R. Weaver, Arjen van der Wel, Katherine E. Whitaker, Yunchong Zhang, Kumail Zaidi
First Author’s Institution: Department of Physics and Astronomy, Tufts University, 574 Boston Avenue, Suite 304, Medford, MA 02155, USA
Status: Submitted to the Astrophysical Journal Letters [open access]
Universe Breakers
The James Webb Space Telescope (JWST) launched in 2021, and one of its key goals was to observe the first galaxies as they formed. Early results from JWST found something surprising: extremely massive galaxies in the early Universe that had “quenched,” or stopped making new stars, much faster than was expected. These early results led some to believe that our understanding of how quickly massive galaxies can form and quench was fundamentally wrong.
Before concluding that our understanding of the universe is broken, it’s important to find other reasons why we might see very massive galaxies in the early universe. One theory is that these galaxies are actually less massive than we think. To “weigh” a galaxy, astronomers first measure the amount of light being emitted by that galaxy. If all the light in a galaxy comes from stars (which should be true in the early universe, though active black holes can contribute a lot of light in some galaxies), you can infer the total number of stars by accounting for the average amount of light emitted per star of a certain mass; this is called the “mass-to-light ratio.” Since massive stars emit a lot more light than low-mass stars and high-mass stars die out faster than low-mass stars, the mass-to-light ratio is higher for older stellar populations. To accurately “weigh” a galaxy, scientists therefore need both a good measurement of the total amount of light in the galaxy and how old its stellar population is. The authors of today’s paper suggest that the uncertainty in these measurements might be leading to over-estimates of galaxy masses and underestimates of galaxy star formation rates, possibly explaining the existence of the earliest massive quiescent (non-star-forming) galaxies.
The Impact of Color Gradients
Previous works about the massive quiescent galaxies in this study used spectroscopy to determine the galaxies’ masses and star formation rates. These spectra were taken with a “slit,” which introduces a source of error: if the slit is smaller than the image of the galaxy, some of the galaxy’s light will be missed in the spectrum. Astronomers usually correct for this by checking how much of the total light of a galaxy image is covered by the spectrum and scaling it up to account for the missing light, but this correction assumes that the spectrum is basically the same across the entire galaxy.
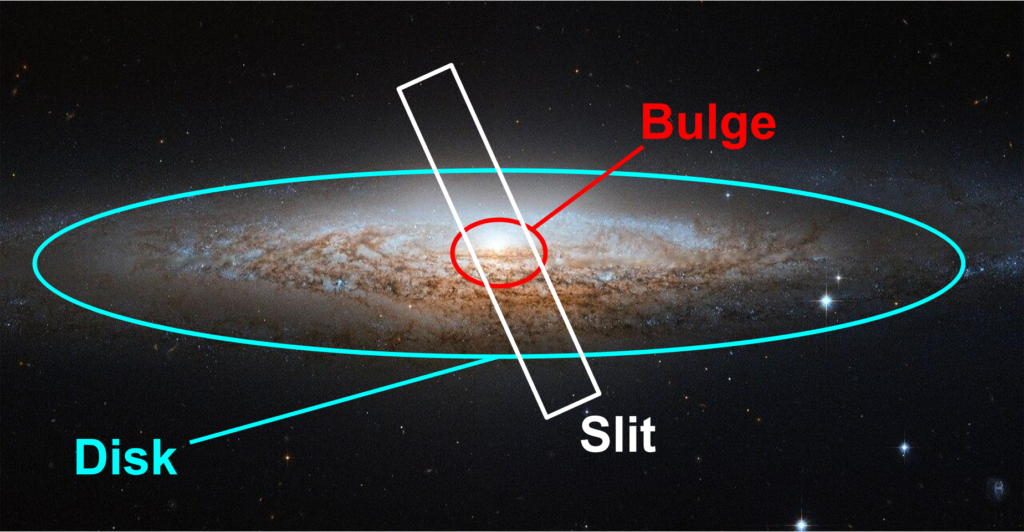
However, this assumption is rarely correct. In the local universe, star-forming spiral galaxies like the Milky Way tend to be made of a central “bulge” surrounded by a “disk” (see Figure 1). The bulge contains more stars and is no longer actively forming new stars, leading to a red-to-blue color gradient as you move out from the center of the galaxy. In astronomy, this is considered a “negative” color gradient. A slit that only covers the galaxy center would lead to an overall overestimate of the stellar mass and underestimate of the star formation rate. If the galaxies instead had a positive color gradient, with more star formation in the center of the galaxy, the mass would be underestimated and the star formation rate would be overestimated. Galaxies with both positive and negative color gradients have been found in the distant universe. By measuring the color gradient for each individual galaxy in their sample, the authors can correct the mass and star formation rate calculations from spectra taken with a slit spectrograph.
Results
Instead of using spectra, the authors of today’s bite use imaging in different filters to measure color gradients for a sample of four galaxies in the early universe that had previously been found to be extremely massive and no longer star-forming. They use medium-band filters, or filters that let in only a small part of a galaxy’s spectrum, to produce a Spectral Energy Distribution (SED) at each radius. This SED is less informative than a spectrum (think a handprint versus a fingerprint), but it’s detailed enough to model the likely stellar population at each radius to determine whether the galaxies have positive, negative, or no color gradients, allowing for better corrections to the properties measured from the galaxies’ centers. They also model the stellar population from the central part of the galaxy that would normally be covered by a slit and from the actual spectrum to test whether any differences in their results come from their choice of modeling techniques.
The authors find that two of the four galaxies have a negative color gradient, meaning the outside is bluer than the inside; a third has a negative color gradient. The fourth galaxy has a relatively flat color gradient, though this measurement is less certain due to the object’s redshift. When the authors plot the galaxies’ colors on a diagnostic diagram that separates red and old galaxies from young and blue galaxies, they find that three of the four galaxies have centers that appear red and old but outskirts that appear young and blue (Figure 2). This means previous measurements of the mass may have been overestimated, and previous measurements of the star formation rate may have been underestimated.
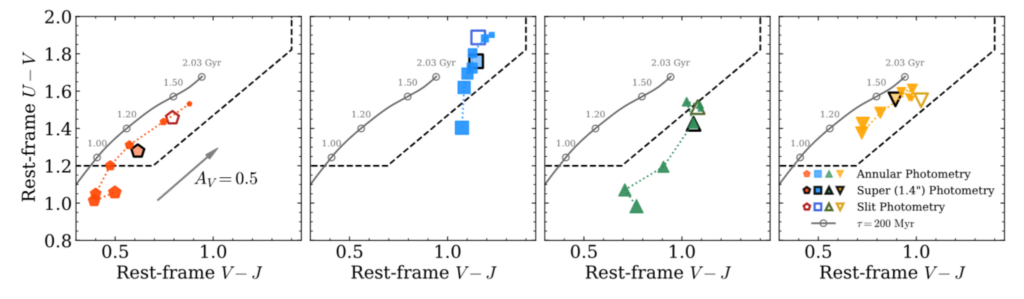
Next, the authors model the stellar ages across the galaxy using SED modeling. SED modeling compares the measured SED to libraries of stellar spectra, rules about how different dust or chemical composition impacts galaxy appearance, and observational effects to predict the actual stellar makeup of a galaxy. In this case, the authors can’t know for sure whether the redder colors at galaxy centers come from an older stellar population, more dust, or changes in the chemical composition (the so-called “dust-age-metallicity degeneracy”). To account for this, the authors try modeling the stellar population two ways: once by assuming all change in color comes from a change in stellar age, and again by allowing the dust and chemical composition of the galaxy to change with radius. They find that if only the stellar age varies across the galaxy, age gradients in the galaxy stellar population can bring the estimated galaxy masses and star formation rates back toward agreement with models of galaxy evolution in the early Universe, though not all the way. However, allowing dust and chemical composition to change across the face of the galaxy lead to higher stellar masses and less star formation, meaning the mystery may not yet be solved.
Is the Universe broken?
To determine whether these galaxies still count as “universe breakers,” the authors use a cosmological model to predict the largest expected galaxy mass in the observed area at different periods in cosmic time. The previous results had less than a 0.3% chance of occurring under current cosmological models; with their updated numbers and stellar population models, the authors find that the observed galaxies sometimes have more than a 5% chance of occurring, though there is still tension. They point out that their analysis ignores processes that could help galaxies grow and quench in the early universe like galaxy mergers; still, the existence of these massive galaxies with such low star formation rates remains a puzzle.
Astrobite edited by Ansh Gupta
Featured image credit: Credit: NASA, ESA, and the Hubble Heritage Team (STScI/AURA), William Blair (Johns Hopkins University)
