- Paper Title: The OPTX Project V: Identifying Distant AGNs
- Authors: L. Trouille, A. J. Barger, & C. Tremonti
- 1st Author’s Institution: Center for Interdisciplinary Exploration and Research in Astrophysics (CIERA) and Department of Physics and Astronomy

This figure shows galaxies (blue), composites (grey), and AGN (red) separated on the traditional BPT diagram, with line emission ratios on each axis.
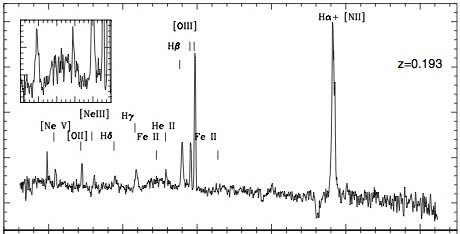
So if the BPT diagram works so well, why change it? The answer lies in the fact that as one looks to galaxies that are farther away (at higher redshift, z), the emission lines needed to make a BPT diagram quickly shift out of the optical window and into the infrared, where getting spectra is much, much harder. In fact, beyond z > 0.4, the BPT diagram can no longer be used! In 1981, when it was created, a redshift of 0.4 was still relatively high, but now it seems practically nearby. Therefore, the authors of this paper have created a new diagnostic, similar to the BPT diagram, but which relies on the emission lines [NeIII] and [OII] that are at shorter wavelengths (see the spectra above), and uses a completely different feature for the y-axis – restframe (g-z) color. The authors call this the TBT diagram (after their last names – Trouille, Barger, and Tremonti), and in their paper, they show that it works just as well as the BPT diagram to separate star-forming galaxies from AGN, is actually BETTER at finding AGN that are X-ray obscured, and best of all, can be used out to z = 1.4.
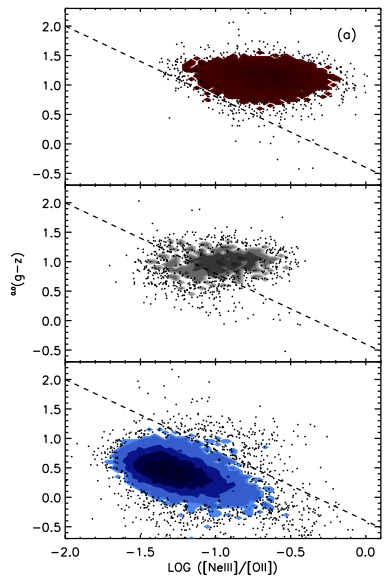
The "TBT" diagram, which uses the NeIII to OII ratio and (g-z) color to classify objects as AGN or star-forming galaxies.
Shown at right is an example of the TBT diagram, made with the same SDSS galaxies that were used to create the BPT diagram shown above. The dashed line is the authors’ empirical cut between star-forming galaxies and AGN. As the figure shows, the TBT diagram cleanly separates star-forming galaxies (shown in blue) from AGN (shown in red). The intermediate galaxies (shown in grey), are traditionally called “composites”, because their emission lines are probably excited by a combination of ionizing photons from stars and from an AGN. Unlike the BPT diagram, the TBT diagram places the majority of composite galaxies on the AGN side of the dividing line. To test whether this is valid, the authors look for X-ray emission in these composite galaxies – a sure sign of AGN activity. They find that the galaxies do in fact have weak X-ray emission, indicating that there is probably a heavily obscured AGN at their centers. In addition, the authors find that the TBT diagram places almost all X-ray selected AGN in the correct region, which the BPT diagram fails to do (see Figure 4 in the paper). They suggest that perhaps the TBT diagram does such a good job distinguishing AGN because the [NeIII] emission line it relies on has a higher ionization potential than [OIII], making it a better probe of the high-energy photons that can only come from AGN.


Trackbacks/Pingbacks