Authors: A. Chiavassa, C. Pere, M. Faurobert, G. Ricort, P. Tanga, Z. Magic, R. Collet, M. Asplund
First Author’s affiliation: Laboratoire Lagrange, UMR 7293, CNRS, Observatoire de la Côte d’Azur, Université de Nice Sophia-Antipolis, Nice, France
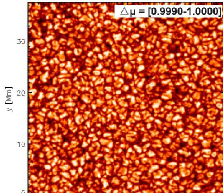
Figure 1: Image of the total intensity illustrating the grainy structure on the solar surface observed by the HINODE SOT/SP spectropolarimeter. The units are Mm.
Paper status: Accepted for publication in Astronomy and Astrophysics
Background and some history
Our view of the Universe has changed dramatically over the past centuries — from a geocentric view of the Earth being at the center of the universe to a picture where the solar system is only one out of billions of planetary system. Astronomers’ recent achievements in the field of exoplanets has pushed forward this evolution in thought. According to http://exoplanets.org/, by today the detection of 1523 planets has been confirmed, and another 3303 observations reveal additional candidates.
As you may know, exoplanets can be observed by different techniques such as radial velocity, gravitational microlensing and direct imaging. However, the most prolific planet-finding survey, which detected 1013 of the currently known planets and all of the candidates, is the Kepler Mission, a space telescope that utilizes the transit technique. The transit technique observes the drop in the stellar light profile, when a planet travels between its host star and the observer. While the underlying principle is easy to understand, reality is more difficult. Besides the fact that the planet has to orbit the host star in the line of sight of the observer, in many cases the actual drop in the light profile is rather small and could also be caused by effects on the star itself. One well known effect can be even observed from Earth with the naked eye: Limb-darkening. When looking into the sky, the Sun appears as a disk and the outer edges (the ‘limbs’) appear darker. Due to the line of sight, you cannot look as deep into the Sun at the limbs as in the center. Together with the average gradual decrease of temperature with increasing solar radius, the Sun appears brighter in the middle of its projection than at its outer edges.
The focus of the paper
The authors of today’s paper are particularly interested in constraining the influence of a process called granulation. You can see the grainy structure on the solar photosphere in Fig. 1. The reason for this structure has to do with the fact that the Sun is so hot that it does not consist of solids, but of plasma. In the outer regions of the Sun, bubbles of plasma with different temperatures exist, which rise in the Sun’s atmosphere and lead to the grainy structure. The term for such movements is convection and the corresponding region in the Sun is named convection zone.
The authors of today’s paper want to find out how convection — and especially granulation — affects the light curves of transiting exoplanets. In order to do that, they study the effects of a transit in the solar system (‘at home’ so to speak): the transit of Venus. A pair of transit events of Venus occurs in intervals of a bit more than 100 years.* As a patient Astrobites reader, you may remember that the last pair of transits has happened only a few years ago in 2004 and 2012. With respect to this paper, the observations reveal relatively precise reference measurements for a transit event.
Granulation could be an important effect
The authors use results from simulations of the solar convection processes to create several images of the Sun. These images are then used as the background light source across which the transit occurs . The transit of Venus is then modeled in the same way as it has been observed by the satellite ACRIMSAT. Figure 2 illustrates the light curves for the transit for these solar images in comparison to the actual observation of the transit event in 2004. According to the authors, the data for the more recent event in 2012 cannot give an appropriate reference measurement because the error bars are too large. As you can see, the model is in good agreement with the observation of the transit in 2004 as other models have been, too.
To compare the impact of the level of granulation estimated in the simulations with observations, they create another image of the Sun. This time they use observational data for the granulation patterns (see Fig. 1) instead of the data from the simulations. Since these results are in good agreement with each other (see Fig. 3), the authors claim that, in addition to limb-darkening, granulation is an important factor, especially for the ingress and egress (the entering and exiting phase of the planet between the line of sight of the Sun and the Earth). However, the authors also admit that the effect induced by granulation is of the same order as the differences among other solar models. Nevertheless, they expect granulation to be increasingly important in the detection of ever-smaller transiting planets. In summary, the most interesting part of the paper is its underlying idea of benchmarking results for transits. In that respect, the transit of Venus provides a nice benchmark for testing our understanding of transit observations.
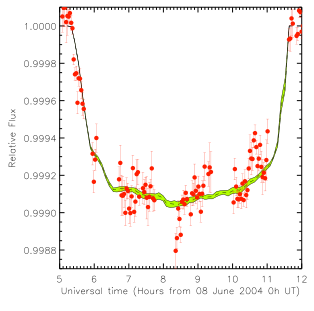
Figure 2: Illustration of the range for the estimated transit curve of Venus as obtained from the different solar images (green band) compared to the observation of the transit by the satellite ACRIMSAT in 2004 (red dots).
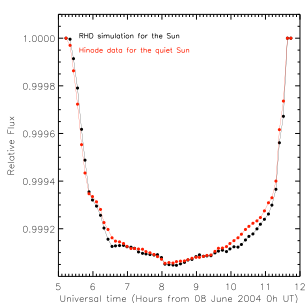
Figure 3: The black curve shows the transit model using the data from the simulation for the solar image. The red curve shows the light curve obtained by creating the solar image based on observations of the granulation (see Fig. 1).
*You might wonder, why don’t we see it more often? The Earth orbits the Sun in one year, while Venus is located closer to the Sun and its orbital time is approximately 224.7 days, Venus should be in the line of sight between the Earth and the Sun more frequently. Assuming both planets on circular orbits in a plane around the Sun, you can estimate the period between the events easily. Venus covers v_Venus=360/224.7 degrees per day, while the Earth covers only v_Earth=360/365.25. A transit occurs, when both planets are at the same angular position again, which occurs after t*v_Venus-(n*360°)=t*v_Earth-(N*360°), with n and N being the number of full orbits of Venus and Earth, respectively => t=(n-N)*360°/(v_Venus-v_Earth)=(n-N)*360°/0.61°=(n-N)*584*days, which means that you would expect a transit about every 584 days or in other words every 1.6 years. However, a transit of Venus is much more rare, which is due to the misalignment of Venus’ and Earth’s orbital planes. There are only two sweet spots (one in winter one in summer), where Venus actually travels in the line of sight between the Earth and the Sun. But remember, there are two transits per interval, which are only eight years apart before you have to wait for more than 100 years again. The reason for that is that the two planets are long enough in one sweet spot to see two Venus transits before they leave the sweet spot again. (Look here for a nice animated explanation of the phenomenon.)



Does the paper describe what is the limiting size for the effect of granulation to be necessary for consideration? (It seems current studies are not yet taking this into account and I was wondering if technology has yet to catch up to provide the ability to find the planets for which this will be important.)
Thanks for your comment. As I wrote at the end of the bite:
“However, the authors also admit that the effect induced by granulation is of the same order as the differences among other solar models.” Thus to be fair, I don’t think it’s very clear from this paper, what the actual effect of the granulation effect is. The fact that they show a comparison of other models to their own, but NOT a comparison of the other models to the observations is (probably) just because of that. Nevertheless, their conclusion that granulation can make a bigger difference for small exoplanets sounds convincing and it would be nice to constrain that further.
Hi Michael – thanks for posting this. I am a little surprised by Figure 2; it seems that there is some kind of dip feature around 8.5 hours in the data from the 2004 observation, and a peak feature around10.5 hours, both of which seem to go unexplained. Do we know what causes those?
Hi Michael, really interesting article! I never considered granulation as having an effect on light curves. I can understand how granulation could effect the light curve for Venus’s transit since the Sun is so close, but does granulation noticeably effect the light curves and observations for distant stars? Granulation is definitely an good topic to explore further. Thanks!