Authors: Jack T. Wilson, David J. Lawrence, Patrick N. Peplowski, Joshua T. S. Cahill, Vincent R. Eke, Richard J. Massey, Luis F. A. Tedoro
First author’s institution: Johns Hopkins University Applied Physics Laboratory
Status: Submitted to Journal of Geophysical Research: Planets, 2018 [open access]
Dear readers, let’s begin with a cheerful thought for the start of northern hemisphere springtime: Think of the delightful lengths people have gone to to find out what the Moon is made of. We’ve taken pictures. We’ve gathered rock samples. We’ve driven a little car around on it. We’ve even crashed a spacecraft into the surface to kick up moon dust to analyze.
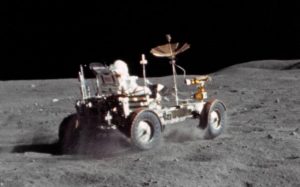
Figure 1. A little moon car
All of this effort has told us an extraordinary amount–we now hypothesize that the Moon is a big old chunk of Earth, sheared off in a collision between a young Earth and a mysterious protoplanet in the early days of the Solar System. We know that it’s rich in water ice, which is good news for would-be lunar settlers. We know that its surface once flowed with magma.
But if we want to know more, we have to be even cleverer. We have to look at the Moon in new ways, through new lenses, with new telescopes. In 1998, NASA’s Lunar Prospector mission did just that, taking photos of the moon in gamma-ray light, the most energetic category of light that astronomers observe.
These pictures are now twenty years old, but I just heard about them yesterday when this paper was posted, and I was amazed. How on earth (how on moon?) is the Moon, by all accounts a large sphere of cold rock, producing gamma-ray light? Gamma rays are the province of supermassive stars exploding, of neutron stars spinning at incredible speeds, of (theoretically) dense swarms of dark matter particles annihilating in the center of the Galaxy. Indulge me in a niche metaphor: if gamma rays are Bruce Springsteen’s 1973 classic, “Rosalita,” then the Moon is Bruce Springsteen’s 1982 classic, “Nebraska.”
How to draw gamma rays from a stone
The answer is twofold: First, gamma rays are produced naturally as certain elements age and undergo radioactive decay. The Moon, like Earth, has traces of uranium, thorium, and potassium in its crust; when the nuclei of one of these elements spontaneously decays, it spits out a gamma ray, which can then be detected by a telescope like the Lunar Prospector.
In the Moon’s younger, more molten days, the constituent elements of the lunar crust were freer to mix around and sort themselves according to density, temperature, and chemical properties. The radioactive elements listed above preferentially melted away into streams of magma, where they stayed as the Moon cooled and hardened. As a result, in the present day, we can use the Lunar Prospector’s gamma-ray maps to identify which regions of the Moon’s crust have the most of these elements and were thus likely to have been formed by streaming magma.
Second, gamma rays can be produced when high-energy cosmic ray particles collide with the Moon, imparting so much energy to a lunar atom that it needs to give off a gamma ray photon to get back to normal.
Cosmic rays are also energetic enough to knock neutrons off of the Moon atoms they collide with, and the Lunar Prospector had a separate instrument to detect and map these loose neutrons. Neutron mapping is just as important as gamma-ray mapping for measuring the composition of the Moon’s crust, because loose neutrons don’t usually take a straightforward path from their parent nuclei to the Lunar Prospector’s detector. Instead, they pinball around on the way; if they collide with a lot of nearby lightweight atoms (namely, hydrogen), they lose a lot of speed and are moving very slowly by the time they’re detected. So lots of slow neutrons are an indicator of high hydrogen content in the crust.
Better and better maps
Both gamma-ray and neutron “photos” of the Moon’s surface tell us a lot about its composition and formation history. The higher-resolution these photos are, the more detail we can glean from them. Cue today’s paper, which uses state-of-the art image processing algorithms to sharpen and refine the gamma ray and neutron photos taken by the Lunar Prospector twenty years ago.
To do this, they ask: At every point in the low-resolution map that we already have, what is the smallest spatial scale that contains any information? In other words, how high can the image resolution actually get at each point before we’re only resolving noise?
The smallest meaningful, informative neighborhood around each point in the image is called a “pixon,” and it can range from smaller than a pixel in size to several pixels across. In their algorithm, which is called a “locally adaptive pixon” approach, they start with an empty map of pixons. Then they iterate over two steps: first, they adjust the value of the gamma-ray flux (or neutron flux) in each pixon to match the lower-resolution 1998 data, and second, they vary the scale of all the pixons until each contains roughly the same amount of information. These two steps enable them to reproduce the information contained in the 1998 photos at higher resolution, without reproducing the noise.
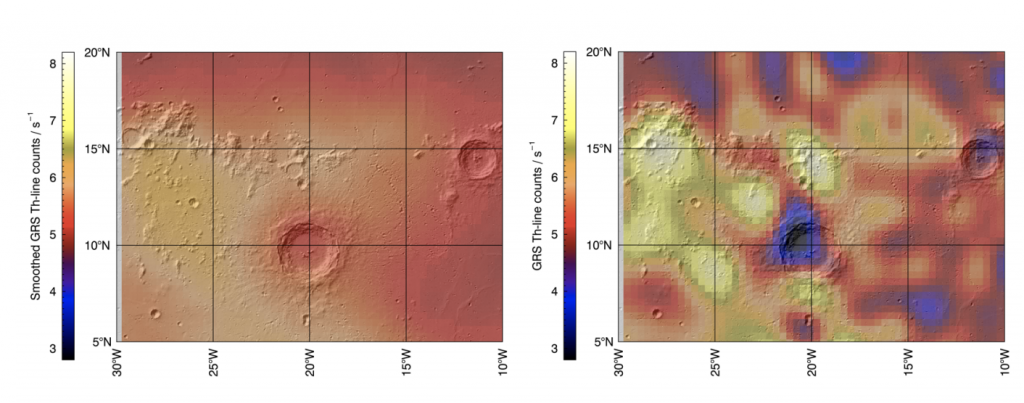
Figure 2. The Copernicus Crater. Left: An unprocessed map of gamma rays emitted by thorium atoms in the Moon’s crust (in color), overlaid on a higher-resolution optical picture of the surface. Right: The same data, processed by a locally adaptive pixon algorithm. Notice the much stronger contrast between the highest and lowest values.
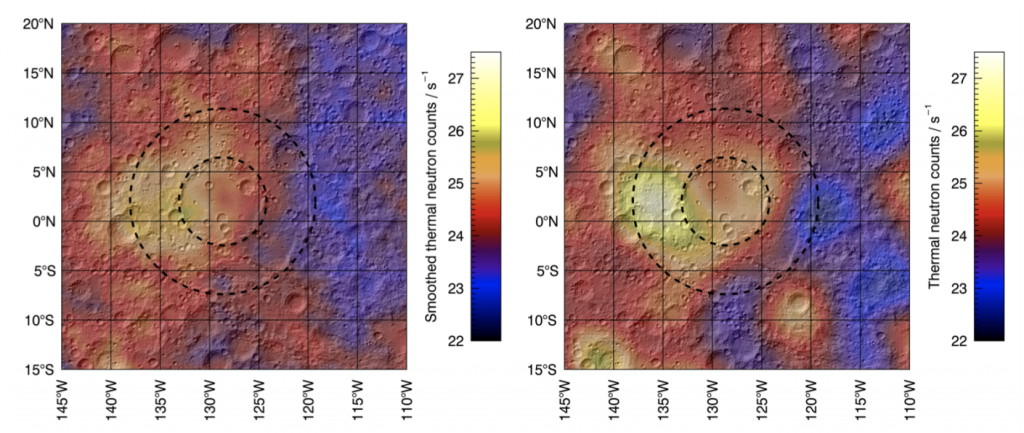
Figure 3. The Hertzsprung Basin. Left: An unprocessed map of neutron flux (in color), overlaid on a higher-resolution optical picture of the surface. Right: The same data, processed by the same locally adaptive pixon algorithm.
Resolution
Scientifically, the higher resolution is important for two reasons. First, it localizes particular elements in the Moon’s crust, such as thorium, to more specific places. And second, it increases the so-called “dynamic range” of the photos. Where once was a blurry smear of medium-intensity gamma rays emitted by thorium atoms in the Copernicus crater, for example, we now have neighboring patches emitting fluxes that differ by a full factor of 2. So we have a much better constraint on the minimum and maximum amounts of thorium in that region. Not bad for 20-year-old data!
Featured image via.
Author