The Undergraduate Research series is where we feature the research that you’re doing. If you are an undergraduate that took part in an REU or similar astro research project and would like to share this on Astrobites, please check out our submission page for more details. We would also love to hear about your more general research experience!

Anna Estes
University of Colorado Boulder
This guest post was written by Anna Estes. Anna is an undergraduate studying Astrophysics at the University of Colorado Boulder. She completed this work as a research assistant under the supervision of Dr. Meredith MacGregor. She presented these results at the 237th AAS meeting, and plans to begin her graduate studies in the fall.
Stellar flares on cool M dwarf stars like Proxima Centauri, which hosts the closest exoplanetary system to Earth, may affect the atmospheres and potential habitability of orbiting planets. I present a thorough, millimeter wavelength analysis of stellar flaring activity on Proxima Centauri using the Atacama Large Millimeter/submillimeter Array (ALMA). Typically, ALMA data is averaged over multiple observations in order to maximize sensitivity to faint sources. I have shown that we can use already-existing tools to analyze this millimeter data in much finer time bins (i.e., instead of only looking at one image made up of a few hours worth of data, we can analyze those same few hours of data but in ~5-second increments) to learn about stellar flares and other time-variable phenomena.
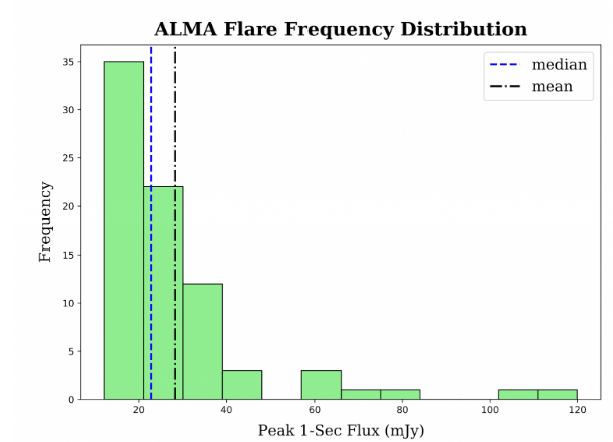
This observing campaign spans April through July 2019, and provides overlapping observations from the following telescopes: ALMA, Evryscope, duPont, LCOGT, TESS, HST, Swift, Chandra, and ASKAP. Observing the same source from this wide range of wavelengths can give us a much clearer picture of the physics at work. For instance, optical and high-energy wavelengths are known to trace different parts of the stellar atmosphere during a flare. I wrote automatic pipelines to probe ~40 hours of on-source (time spent observing the source, after accounting for telescope calibration time) ALMA observations for flaring activity, creating the first Flare Frequency Distribution (FFD) at millimeter wavelengths (Figure 1). This work has confirmed our predictions that flare frequency follows a power-law distribution, with small flares occurring most often, and large flares being rather rare.
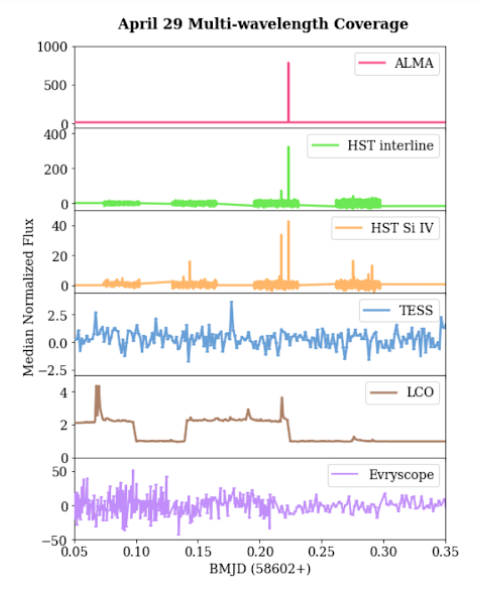
My analysis also revealed an exceptionally bright millimeter wavelength flare on April 29, 2019 (Figure 2), where the star brightened by a factor of ~780. This event shows an apparent correlation between far-ultraviolet (FUV) emissions (HST observations) and millimeter wavelength emissions (ALMA observations). This correlation was first seen in another flaring event from this observing campaign [1]. Emission at these wavelengths trace each other closely, exhibiting the same rise and fall times. Because UV radiation can ionize and strip a planetary atmosphere, FUV data is of special interest for exoplanetary atmosphere models.
My work has also highlighted a possible decoupling of the optical data. In other words, optical flares do not exhibit any correlation to millimeter or FUV flaring activity. Although this phenomenon still requires further investigation, this work challenges a long-standing assumption that optical and UV signals correlate, and that emission from one wavelength can be used to estimate emission from the other. These preliminary results from this observing campaign have already begun to challenge our traditional understanding of stellar flares on M dwarfs. For example, in addition to the discovery of optical decoupling, I have shown that stellar flares can be much shorter (~2 seconds) than were previously thought to occur in the submillimeter.
References: [1] MacGregor, M. A., and 18 co-authors including A. Estes, 2021, submitted to ApJ (in review).
Astrobite edited by: Ishan Mishra