Title: Compression and Ablation of the photo-irradiated cloud the Orion Bar
Authors: Javier R. Goicoechea, J. Pety, S. Cuadrado, J. Cernicharo, E. Chapillon, A. Fuente, M. Gerin, C. Joblin, N. Marcelino, P. Pilleri.
First Author’s Institution: Grupo de Astrofısica Molecular. Instituto de Ciencia de Materiales de Madrid
Paper Status: Published in Nature
Unlike our Sun, massive stars shine bright in ultraviolet light. These photons are energetic enough to strip electrons from, or ionize, surrounding hydrogen gas. The clouds of ionized hydrogen around massive stars are called H II regions. H II regions are often used to trace star formation in galaxies, because massive stars live cosmically brief lives.
Stars are formed when dense clouds of hydrogen collapse under their own gravity. The necessary density for gas to collapse is achieved inside cold dark molecular clouds where most hydrogen atoms are in molecules. When massive stars form in these clouds, ionized and molecular hydrogen interact.
What happens when an ionized H II region collides with a dense molecular cloud? To study such a collision in detail, the authors of today’s paper used high resolution observations of multiple molecules in the Orion Nebula.
The Hunter’s Bar
Orion hosts one of the nearest regions of active star formation in the galaxy. Within Orion, astronomers have found tadpole-shaped proplyds, jets emitted by protostars, and ‘bullets’ of gas fleeing the area. The Orion Nebula is an H II region powered by the Triangulum Cluster of massive stars. The H II region has erupted like a blister from the molecular cloud out of which the stars were formed. The opening carved by the H II region provides a window to newly forming stars that are normally shrouded in dusty molecular clouds.
The Orion Bar is a molecular cloud viewed edge-on, so the surface of interaction between the H II region and the molecular cloud can be studied in detail. Figure 1 shows the Orion Nebula and its Bar in the lower left hand corner.
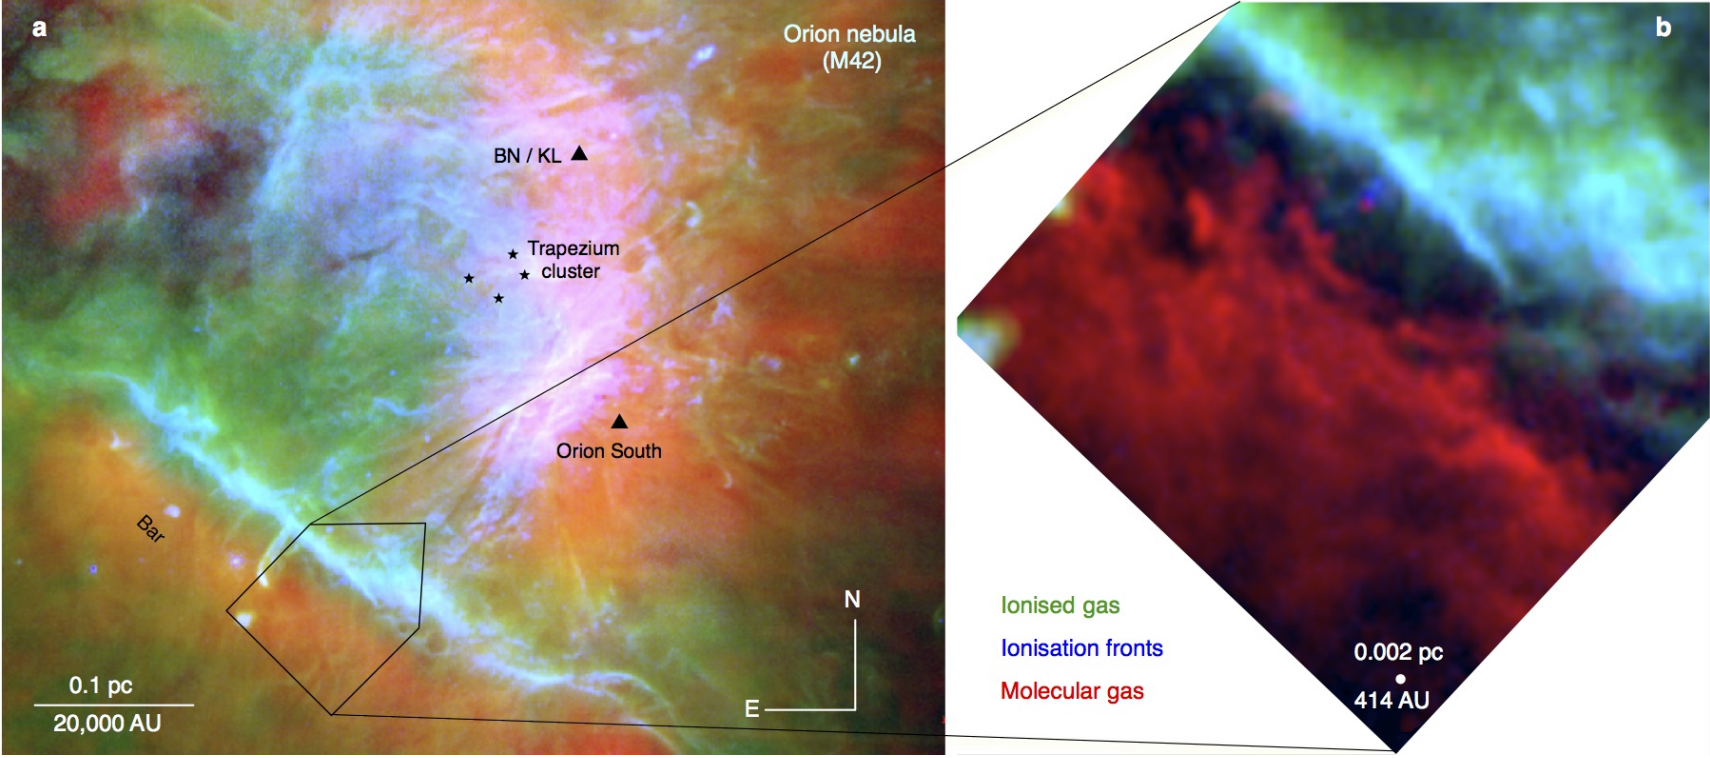
Figure 1. Overview of the ionized Orion Nebula and molecular Orion Bar. The Trapezium cluster is a group of massive stars ionizing their surroundings (green). The ionization fronts show the expansion of ionized gas into the surroundings (blue). The inset shows the area of the high resolution molecular observations presented in the paper (red).
Observing a Collision
The authors took high resolution observations with the Atacama Large Millimeter Array (ALMA) of the interface between the H II region and the Orion Bar. They focused on the two molecules HCO+ and carbon monoxide (CO) which approximately trace the density and temperature of the gas respectively. Using ALMA, the authors could resolve structures of gas as small as 400 AU across. That’s about 1/1000 the distance from the Sun to Proxima Centauri, and 9x better resolution than previous observations.
The inset in Figure 1 shows the coverage of the ALMA observations. The dark gap between the molecular gas (red) and ionized gas (blue/green) is the region where ionizing photons do not penetrate. Here UV photons with lower energy split apart molecules like HCO+ and CO into their constituent atoms. This zone, called the photodissociation region (PDR), is a layer of atomic gas between ionized and molecular gas. Since Figure 1 only shows emission from ionized and molecular gas, the PDR appears dark.
Compressing the Bar
As the H II region expands into the Orion Bar, a shock wave compresses the molecular gas. This compression is shown in Figure 2 as a ridge in the emission of HCO+ perpendicular to the direction of the ionizing photons. Along this ridge, many small structures can be seen. These structures, some as small as 800 AU across, have been compressed by the shock wave passing through the turbulent cloud.
These compressed clumps of gas are far too small to form stars themselves. For larger clumps, the compression of molecular gas by expanding H II regions may enhance gas density enough to trigger gravitational collapse into stars.
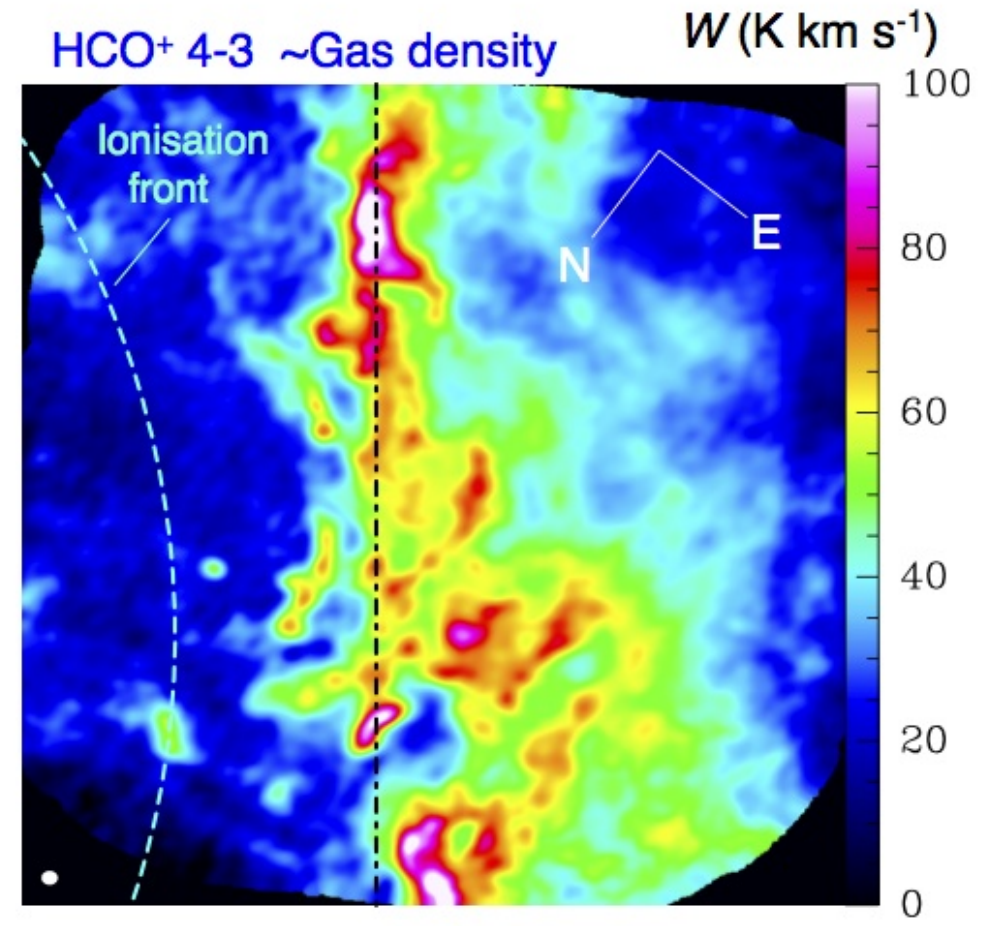
Figure 2. Molecular gas in the Orion Bar. The area is the same as the inset in Figure 1, but rotated so that the UV photons from the massive stars are coming from the left. The cyan curve is the ionization front. The black dashed line indicates the peak of the high density ridge, or the dissociation front. In between the ionization and dissociation fronts is the atomic layer. Gas is mainly ionized to the left of the ionization front, molecular to the right of the black dashed line, and atomic in between.
Molecular Gas Escaping the Bar
Most of the molecular gas in the Orion Bar is confined to the high density ridge discussed above. But Figure 2 also shows plumes of molecular gas extending all the way back to the ionization front. How can molecular gas survive in a bath of ionizing radiation? The authors suggest two possibilities – either these plumes are the remnants of preexisting dense clumps or flows from the molecular cloud.
The densest clumps of molecular gas can shield themselves from complete ionization. When the H II region envelops these clumps, they can resist ionization longer than lower density molecular gas. The plumes of HCO+ emission may be the surviving cores of such preexisting dense clumps.
As the compression wave passes through the cloud, the pressure at the high density ridge is enhanced. This pressure may be greater than the pressure in the ionized H II region. The pressure difference triggers flows of molecular gas from the Orion Bar into the H II region. The plumes of HCO+ emission may be the result of these flows (called ablation).
Surfing on Magnetic Waves
Figure 3 plots the molecular emission as a function of distance from the Orion Bar edge. The HCO+ emission peaks several times to the right of this edge. These peaks appear at a uniform spacing of about 5″ (or 2000 AU). Because they appear periodic, the authors speculate that these peaks may be formed by strong magnetic fields.
When gas is compressed at the ridge, magnetic fields propagate this compression further into the cloud. If this interpretation is correct the HII region is affecting the molecular cloud at greater depths than just the ionization surface. However, the evidence of periodic density fluctuations is circumstantial. Detailed observations of the magnetic fields in this region are needed to support such a scenario.
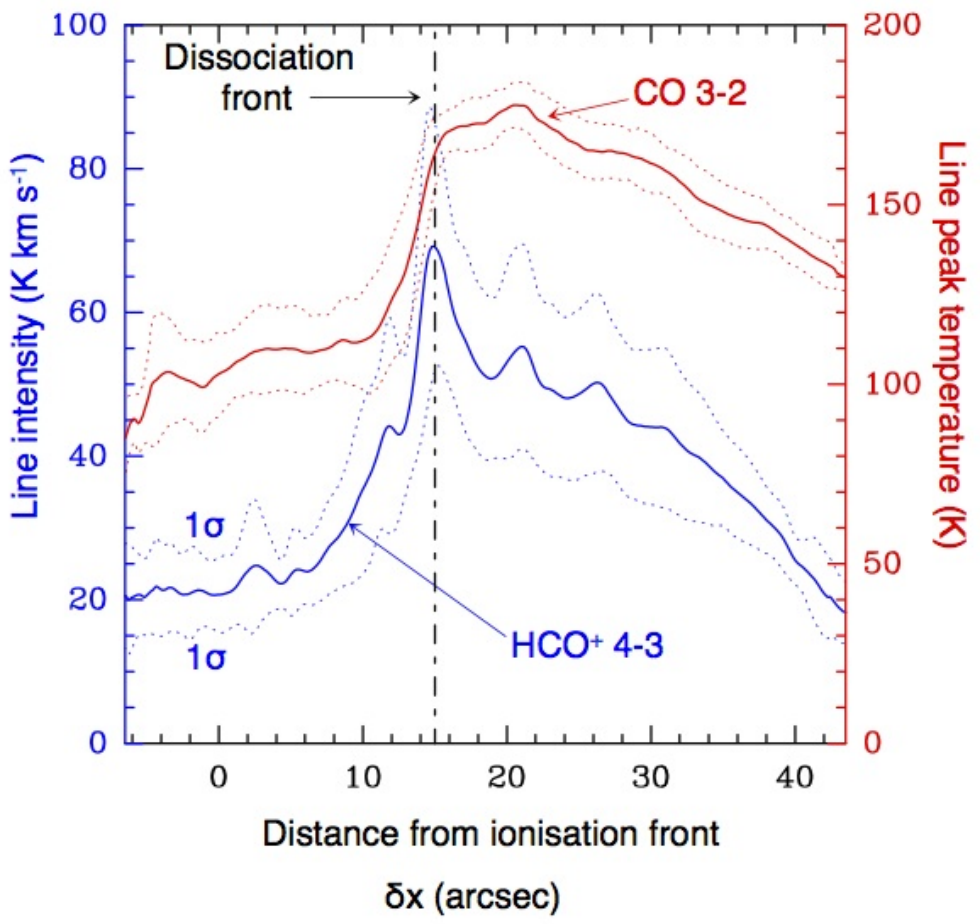
Figure 3. The total intensity of HCO+ emission (blue) and peak intensity of CO emission (red) as a function of distance from the ionization front. The dot-dash line is the high density ridge seen in Figure 2. The peaks of HCO+ to the right of this ridge may represent periodic compression of the gas by magnetic fields.
This study represents one of the sharpest views ever of a collision between an H II region and a molecular cloud. Because all stars and H II regions form in molecular clouds, these interactions can influence star formation. The compression and ablation of molecular gas seen here has been predicted by simulations. High resolution observations like these are now providing a true glimpse of what happens when two extremes – molecular and ionized gas – collide.
Author
I understand that your WordPress button is part of a somehow special theme template. I think it is useless. I will no longer attempt to use your site or reblog your posts. If you abandon this special theme and get or use a standard WordPress theme where you can get a standard reblog button, you know where to find me.