Title: A frequency resolved atlas of the sky in continuous gravitational waves
Authors: Vladimir Dergachev and Maria Alessandra Papa
First Author’s Institution: Max Planck Institute for Gravitational Physics (Albert Einstein Institute)
Status: Published on ArXiv [open access]
To date, the most common types of gravitational wave (GW) detections have been those of binary in-spirals, such as two colliding black holes or neutron stars (NS). Detecting a continuous gravitational wave (CW) signal, however, is an entirely different endeavor. CWs are the signals we expect from long-lived phenomena, such as objects orbiting each other at large distances or pulsars spinning about their own axes. In other words, continuous waves are just that– continuous over time!
Dergachev and Papa, the authors of today’s paper, searched through the first half of the third LIGO observing run (called “O3a”) for CW signals. They provided an atlas showing everywhere they measured and how deep their search was, like probing a field with a metal detector in search of treasure. This is so that future treasure hunters can search deeper in areas where they did not, and to provide constraints on known objects existing in the regions they checked.
The Value of Spacetime Treasure
Black holes colliding and neutron stars merging are not the only ways to create GWs! In fact, scrolling through this article while you read generates GWs, just much much smaller than those from dense, dead stars! When mass of any size moves, it disrupts the fabric of spacetime like ripples in a pond. (In case this is difficult to imagine, here are some previous astrobites on the topic to learn more!)
Two dense objects, such as white dwarfs, NS, or black holes orbiting each other at large distances will not collide anytime soon; yet, they still produce GWs. Signals from their orbits will be observed by GW detectors such as LISA (the Laser Interferometer Space Antenna) in the coming decade.
Similarly to how electromagnetic telescopes observe at different wavelengths, GW detectors operate at different frequencies. The frequency range of LIGO does not capture the CWs of wide-orbit binaries the way LISA would, but it is more favorable for observing individual pulsars (and TŻO’s, if you’re fancy!)
Finding a GW of a pulsar would be like discovering a teeming treasure trove. One of the greatest open mysteries of science is, “What exactly are NS made of?” or, in jargon, determining the neutron star equation of state.” We can begin to answer this by measuring how squishy or hard NS are with GWs, since their squish-ability affects how oblong they appear when they are rotating quickly about their axes. The strongest GW signals are produced by the most deformed shapes.
How to Dig
Your immediate question might be, “well how many CWs have we seen? I’m pretty sure there are a bunch of NS nearby, or at least some recent supernovae?”
Though that’s correct, we have not seen any CWs yet. The catch is that a CW search is extremely computationally expensive. Another complication is that we are not always certain what we are looking for! In a usual matched-template search, such as the method used to find the binary neutron star merger GW170817, we use general relativity to predict the signal of colliding compact objects, then search the data for a match.
However, many objects that produce CWs are difficult to predict with general relativity. But their uniqueness is also their greatest strength. Let’s first take an electromagnetic analog: observing a faint object by holding a telescope aperture open for a long time. If you did this, your object would appear brighter as you collect more photons. If your background was made of random fluctuations (instead of other stars and galaxies), then you’d also have the benefit of smoothing away these unwanted features as you pile up observations.
If you had infinite time and data, you could get an extremely good measurement of a signal. This is a way to intuit an SNR or Signal-to-Noise Ratio. Quite literally, this refers to how clearly the signal stands apart from background noise.
The only catch is, LIGO collects a lot of data— essentially for months, nonstop! When conducting a CW search, it can be difficult to decide between sensitivity and breadth, as you cannot cover large areas of the sky while integrating for a long period of time, just like in a classical telescope. The search conducted by Dergachev and Papa took about 36 million CPU-hours! Thank goodness for supercomputers!
Give Me the Map!
Their search turned up five potential CWs. Unfortunately, four of these signals were most likely due to characteristics inherent to the detectors, such as photon radiation pressure against the mirrors. The remaining outlier, an expert in suspense, barely crossed their SNR threshold and required a second look to be absolutely sure of whether it was actually a CW detection!
The authors reasoned that an astronomical object persistent in O3a data should also be present in 03b (the second half of year 3). When they repeated their search with the larger data set, they did not measure a stronger SNR greater than 13, their cutoff threshold, so they had to rule out the object.
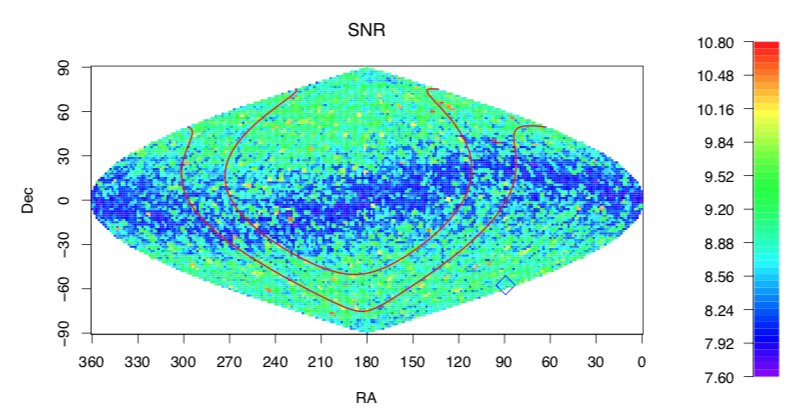
But all is not lost! Dergachev and Papa searched every point on the sky and recorded the deepest SNR they were able to search for a CW signal, leaving behind a treasure map (or atlas) for future studies (Figure 1). The fruits of this search provide constraints for the properties of NS, and crucial upper-limits on known nearby objects. For example, if a supernova astronomer wants to search the sky for a supernova remnant, they can use the atlas to determine if that sky position has already been searched to the distance of their object. Additionally, astronomers interested in large populations of NS can use this data set to calculate limits of the neutron star equation of state and allowed degrees of eccentricity.
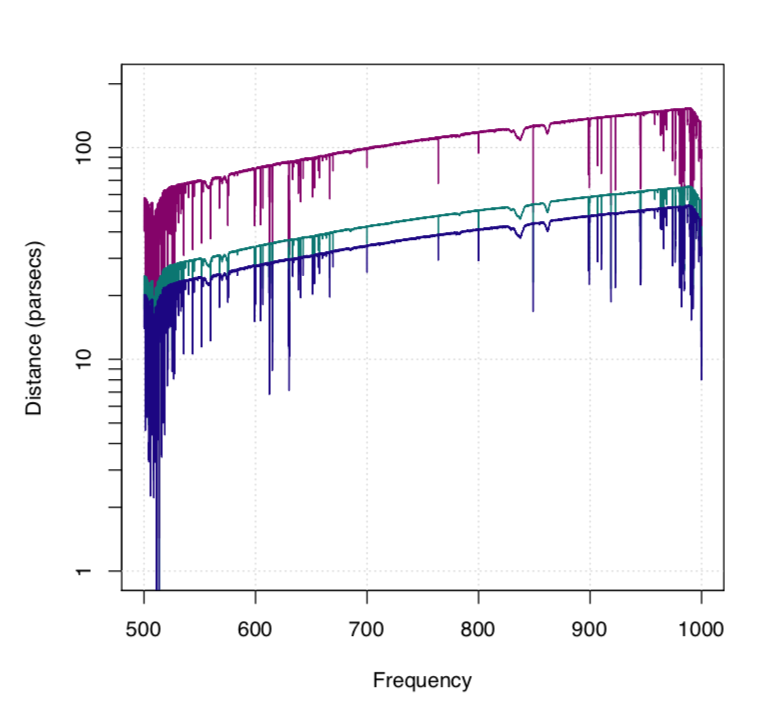
The authors determined NS with an ellipticity (or oblong-ness) of 10−8 can be detected up to 150pc (489 light years) away. Further out between 500pc and 1500pc, no sources with ellipticities of 10-7 could be detected at high LIGO frequencies, and the authors ruled out sources located between 200pc and 600pc at the lowest frequencies. (Figure 2).
Astrobite edited by Pratik Gandhi
Featured image credit: drslack.net, universetoday.com, ageofpirates.com