Authors: Grisha Zeltyn, Benny Trakhtenbrot, Michael Eracleous, et al.
First Author’s Institution: School of Physics and Astronomy, Tel Aviv University
Status: Submitted to ApJ [open access]
Challenging the Original Picture
Supermassive black holes (SMBHs) are among some of the most powerful objects in the universe. Those that are accreting gas from their surroundings (called active galactic nuclei, or AGN for short) release an enormous amount of energy back to their surroundings – enough to unbind an entire galaxy! Historically, AGN have been classified by the emission lines in their optical spectra – Type 1 AGN show broad emission lines, especially from the Balmer series of hydrogen, whereas Type 2 AGN do not show broad emission lines (see this Astrobite for details on the different classifications). As early as the late 1980s/early 1990s, it was hypothesized that these two classifications could be unified into a single model, where the difference in their optical spectra was related to the viewing angle to the nucleus. In this model, broad emission lines can only be seen if the observer is looking close to face-on, whereas these lines tend not to be seen in edge-on systems where the observer is probably looking through dense clouds of gas and dust called the torus (see this Astrobite for more on the dusty torus).
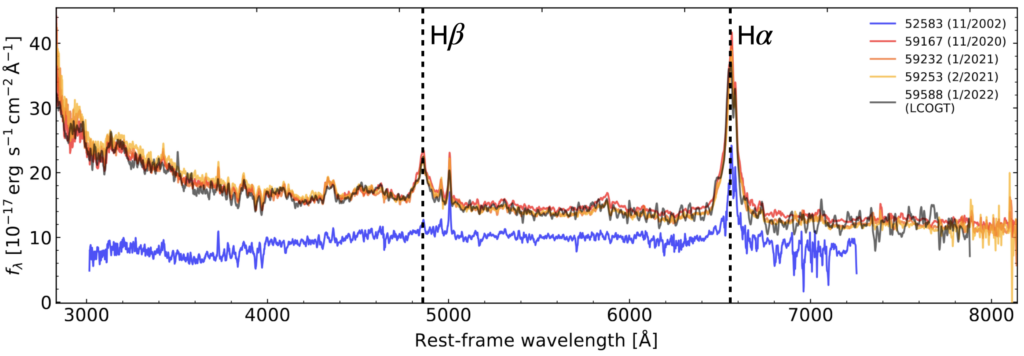
This view is supported by the existence of Type 2 AGN with broad emission lines in their polarized spectra. These spectra only contain polarized light, which can contain emission from the broad lines being scattered off of the gas and dust. However, recently there have been a subset of AGN that show rapid changes between these different spectral types on timescales of months to decades. This new class is called “changing-look” AGN, and they challenge that the viewing angle alone determines the type of AGN you see. An example of a changing-look AGN (newly found in today’s paper) is shown in Figure 1. The black spectrum was taken 20 years after the blue one, and clearly shows a newly formed broad Hβ line as well as an increasing Hα line.
What causes these strange changes, you may ask? There have been two main ideas behind what causes these changing-look events – one being that changes to the amounts of dust and gas along our view to the black hole can drive these, and the other being that there is something intrinsic changing around the black hole, for example how fast the black hole is gobbling up the surrounding material. There have been individual events that have been argued to be either one of these two scenarios, but building up a large sample is crucial to telling which is the dominant cause.
Introducing: Changing-Look AGN in SDSS-V
Detecting changing-look AGN is difficult because the changes occur on relatively long timescales and require multiple optical spectra of the same AGN (which is rather rare!). However, no need to fear, today’s paper is here! The authors of today’s paper present one of the first systematic searches from changing-look AGN using a new survey, the Black Hole Mapper (BHM) program as part of SDSS-V (the fifth generation of the Sloan Digital Sky Survey). This survey was designed to take numerous optical spectra of hundreds of thousands of AGN. Today’s paper focuses on the first year of data, which contains almost 30,000 AGN with multiple optical spectra. From this sample, they find a total of 116 changing-look AGN, which vary on timescales ranging from 2 months to 19 years!
It’s All About The Rate!
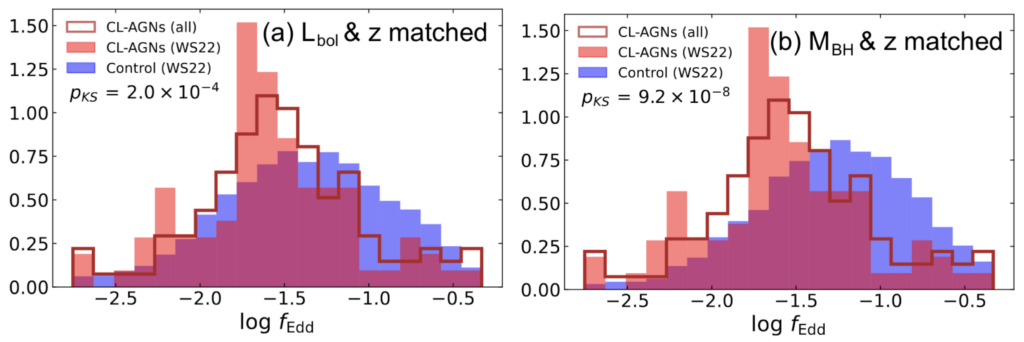
By comparing their new, robust sample of changing-look AGN to a control sample of ordinary AGN, the authors investigated if there were any crucial differences between the two that could help illuminate the origin of changing-look AGN. They found that the black hole mass and total energy output did not change significantly between the two samples, but the accretion rate normalized to the black hole mass (also known as the Eddington ratio) did change. This is shown in Figure 2, with the red showing the changing-look AGN and the blue showing the control sample of ordinary AGN. The two different panels show different control samples, but importantly, they both show this same exact trend. This confirms what other studies have suggested – that the most important factor for setting whether an AGN will undergo a changing-look event is its relative accretion rate!
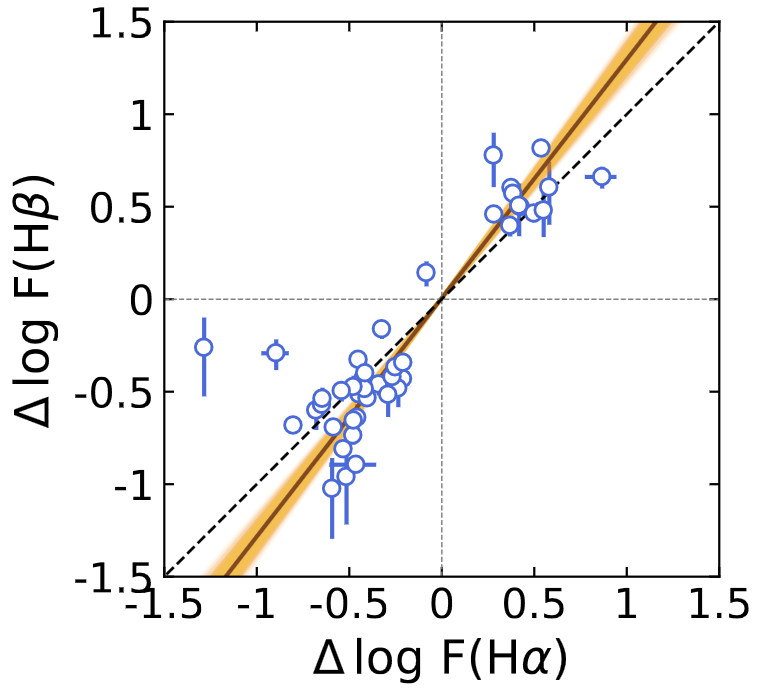
To investigate the dominant cause of these changing-look AGN, the authors use two different measurements. First, they looked at the relationship between flux changes in different lines. For example, in sources where both Hα and Hβ were observed, they found that the two seemed to change in a correlated manner, but the Hβ changes more than Hα on average. They hypothesized that this could be due to variable dust and gas that would affect the bluer Hβ line more. However, the infrared data for most of these objects showed significant changes as well, which is not consistent with this variable dust and gas model. Thus, the authors concluded that the majority of the changing-look AGN in their sample are the result of changes to the accretion rate.
Wondering how these cosmic curiosities fit into the grand picture of AGN? Keep your eyes peeled because this is coming next! The authors stress that continued SDSS-V/BHM observations will lead to larger samples of changing-look AGN and will help us better understand how these changing-look events relate to normal AGN variability.
Astrobite edited by Janette Suherli
Featured image credit: NASA/SOFIA/Lynette Cook