- Title: Luminosity of Young Jupiters Revisited: Massive Cores Make Hot Planets
- Authors: Christoph Mordasini
- First Author’s Institution: Max Planck Institute for Astronomy, Heidelberg, Germany

Figure 1. An artist’s conception of a giant planet forming in a disk of gas. (Image from Dunlap Institute, Toronto.)
Directly imaging exoplanets is a tough business. Only a handful have been found this way, so each new discovery is exciting. But why bother trying to image planets when we can find hundreds of them using the RV and transit techniques? By directly analyzing the light that is emitted by a planet, we can learn a lot about it, such as its mass and the composition and structure of its atmosphere.
In this paper, Mordasini argues that making conclusions about an imaged planet — specifically about its mass — is more difficult than we typically assume.
The usual logic goes as follows: giant planets inevitably have some heat leftover from their formation, and they cool gradually over time. More massive planets start hotter, so there are different cooling curves for planets of different mass (these cooling curves are predicted theoretically). We can measure the brightness (luminosity) of a directly imaged planet , and we can also estimate the age of the planetary system (how this is done is a story for another day). With these two pieces of data (luminosity and age) we can place the planet on a specific cooling curve and determine its mass.
A small complication arises because there are actually two theories for how giant planets form: core accretion and gravitational instability. These two theories predict two different sets of cooling curves.
Core accretion is a bottom-up process where, first, a solid core forms from the accumulation of smaller objects. Then, when the core reaches a critical mass (typically assumed to be 10 Earth masses), it accretes gas from the protoplanetary disk in which it is embedded, growing to the size of Saturn, Jupiter, or even larger. The accreting gas is shock heated, allowing the initial gravitational potential energy in the gas to be quickly radiated away, leaving the infant planet relatively cool (this is called a “cold start”).
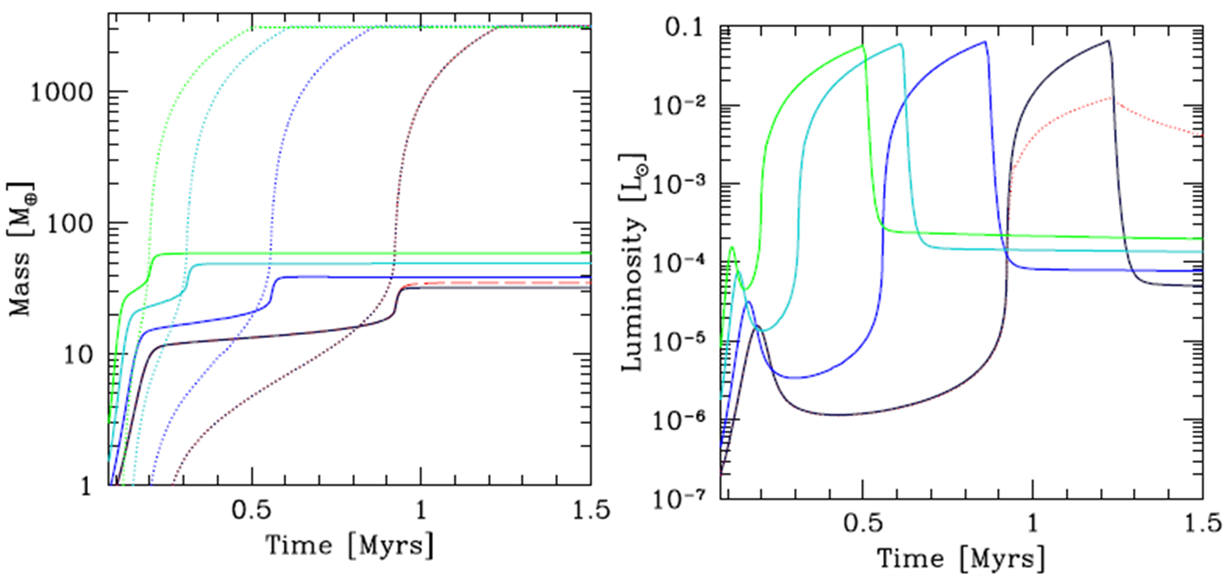
Figure 2. Core accretion simulations showing that core mass affects luminosity. Four planets are simulated (represented by the four colors). Each planet ends with the same total mass, but a different core mass. The left panel shows the mass of the cores (solid lines) and the gas (dotted lines) growing with time. The right panel shows the time evolution of the planet’s luminosity. Note that larger cores result in larger luminosities at the end of formation. From Figure 1 of the paper.
Gravitational instability, on the other hand, is a top-down process in which a chunk of the protoplanetary disk collapses into a planet under the force of its own gravity. In this case, the gravitational energy is trapped in the gas, making the infant planet hot (this is a “hot start”).
An imaged planet might then have two possible masses, depending on the nature of its formation. However, we typically have some idea that one formation mechanism is more likely than the other (for instance, it is theoretically difficult for core accretion to operate very far from the star, and difficult for gravitational instability to operate near it).
Mordasini takes a closer look at core accretion and challenges the assumption that the core mass is always 10 Earth masses. He uses planet formation simulations to show that varying the core mass changes a planet’s initial luminosity, and creates a new family of cooling curves. Figure 2 shows the results of four of his simulations: all four planets grow to the same total mass (10 Jupiter masses) but each has a different core mass. A larger core results in a larger luminosity.
Figure 3 shows how a new family of cooling curves is generated with each new core mass. Known planets (the grey points) could have a variety of masses, depending on the mass of their core. For very large core masses, the core accretion cooling curves even overlap with the hot start curves (grey lines).
Essentially, Mordasini points out a significant new variable in the problem of characterizing directly imaged planets that, up until now, we had assumed was constant. Imaging new planets will continue to be exciting, but what we can say for sure about the planets we do image is now a but more uncertain.
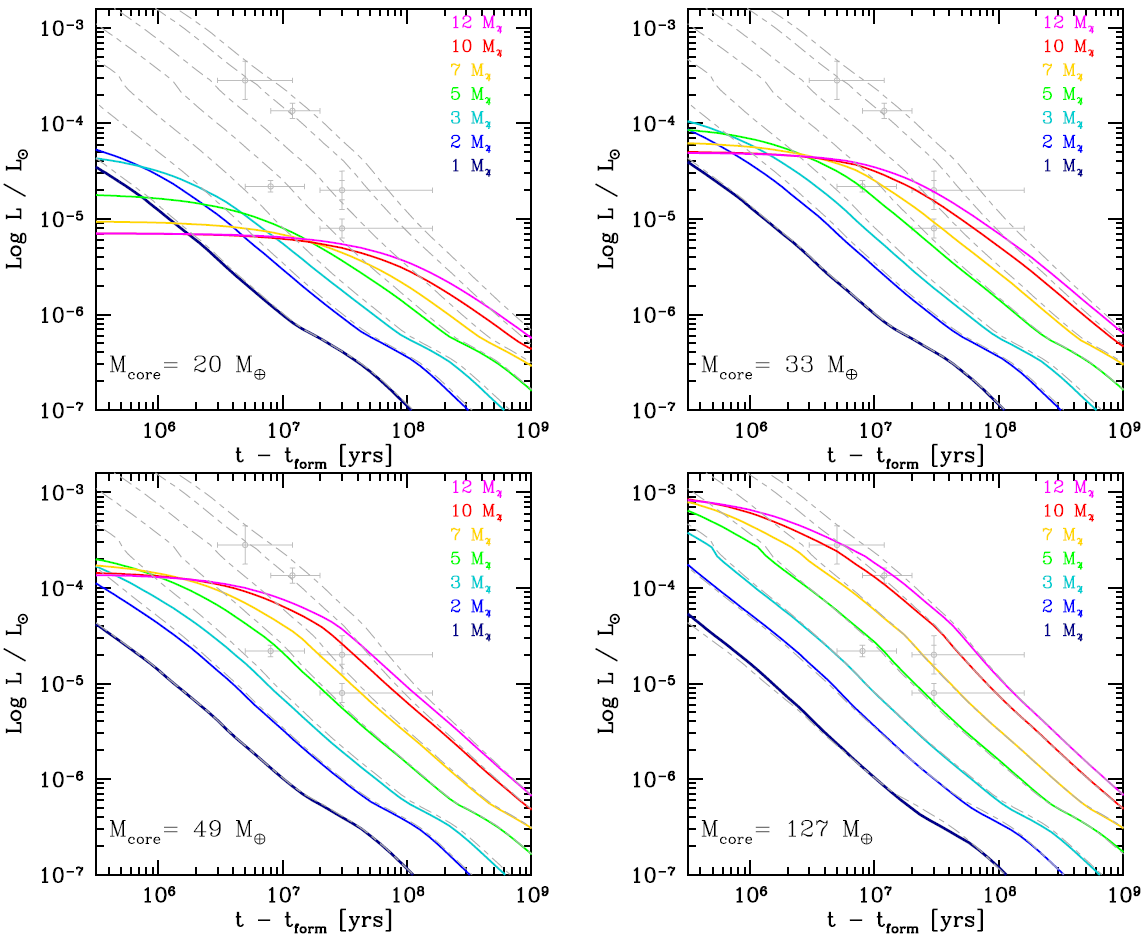
Figure 3. Cooling curves for planets of various total mass (the different colors) and different core mass (the four panels). In contrast with Figure 2, these plots show the long-term evolution of the planet luminosity after formation has completed. Note that the cooling curves shift upwards with higher core mass. The grey points are data from imaged planets. The grey dashed lines are hot start curves. From Figure 3 of the paper.