TITLE: Return to [log-]normalcy: Rethinking quenching, the star formation main sequence, and perhaps much, much more
AUTHORS: Louis E. Abramson, Michael D. Gladders, Alan Dressler, Augustus Oemler Jr., Bianca Poggianti, and Benedetta Vulcani
FIRST AUTHOR INSTITUTION: Department of Physics and Astronomy, UCLA
STATUS: Submitted to the Astrophysical Journal
The problem with astrophysics research, the thing that makes it really difficult, is this: you’re stuck right in the middle of the very thing you want to learn about. Other physicists faced with a lack of knowledge have the luxury of being able to design an experiment that might help them out: not so the unlucky astronomer interested in the distant universe. We can only make observations and hope they shed some light on whatever it is we want to understand. For those of us interested in galaxy formation this creates some real issues. Most importantly, we can’t actually watch galaxies evolve in real time. Everything takes billions of years to happen, so our observations of other galaxies are only snapshots of particular moments in their lives. One way to deal with this is with computer simulations (like this one, or those discussed here), which allow you to follow the whole history of individual galaxies from shortly after the big bang to the present day. However, simulations cannot, of course, match the resolution of the real universe, which means an awful lot of physics is getting swept under the rug. At some point you have to go outside and look up.
But if we can’t watch galaxies evolving, what can observations tell us? That’s the question at the heart of today’s featured paper. The data we get by looking at other galaxies is, the authors note, inherently cross-sectional rather than longitudinal. What they mean is that we never observe the same galaxy at two different (cosmological) times. You can have another look in a few months’ time and it won’t have changed. We do have one thing going for us though: if we look at more distant galaxies, their light has taken longer to reach us, so we see them as they were in the distant past. This means we can assemble collections of galaxies from different eras and have a look at the differences between them. The hope is that this will tell us something about how galaxies in the past have evolved over time to look like those we see around us today. Yet we ought to be cautious of making direct links from one set of galaxies to the other, the authors warn.
This discussion takes place against the backdrop of a curious model for galaxy star-formation histories constructed by the authors over several papers (which are referenced in the text). A star-formation history (a record of when exactly a particular galaxy forms its stars) is really the essential building block of galaxy evolution. When we get down to brass tacks, galaxy formation is all about when and where a galaxy manufactures its stars. They are what make it a galaxy. Unfortunately, the physics of star formation is complex and not as well-understood as we’d like (turbulence, magnetic fields, and shockwaves all have their part to play … probably at the same time). The best we can do is assume some form for the star-formation history (as discussed in this astrobite) which roughly describes the sum of all the processes involved in switching star formation on and off (processes like those described here).
For this the authors use a lognormal distribution, a type of distribution which regularly shows up in nature (usually describing quantities – such as star formation rate – which by definition can’t be negative). As a description of star formation over time, it has the attractive quality that it rises quickly and then decays slowly, which is pretty much how we think galaxies form their stars. It’s also very simple, since it’s defined by two numbers: its width (which controls whether stars form in a quick burst or gradually over time) and peak time (which is related to when, precisely, the galaxy actually starts forming stars).
The values of those parameters for any galaxy can be found if you know only two things: the number of stars the galaxy has formed in total (which you can figure out from how bright it is – more stars, brighter galaxy) and how fast it is currently forming stars (which you can get by measuring how many massive, short-lived stars it contains, since they must have been formed very recently). The authors use these measurements for a sample of nearby galaxies to assign them all star-formation histories. These histories can then be used to project what the galaxies would have looked like at any time in the past. Despite the simplicity of the model, it seems to naturally reproduce the behaviour we measure from distant galaxies (which we see at earlier times). This is almost unreasonable! The authors take pains to highlight the fact that their description is ‘physics-free’, i.e. not motivated by modeling any of the complex processes discussed above. Indeed, one reason we might expect to see a lognormal distribution arise is if no particular process that encourages or discourages further star formation dominates over all the others in play.
Since the model apparently does rather well, the authors persevere with it. Among their many findings, they show that at every time their model is able to reproduce the ‘star formation main sequence’ (a tight relationship between galaxy mass and star formation rate seen at all times, which we’ve mentioned before) as well as the small population of ‘starburst galaxies’ that are forming stars at a much higher rate. What’s different here is their interpretation of this sequence: most researchers assume that galaxies evolve along the sequence, so that as they gain stellar mass (by forming stars), their star-formation rate changes appropriately, until they finally stop forming stars entirely and drop off the sequence. Slight variations in star formation rate that take galaxies above or below the sequence are due to small changes that average out over time. Not so, according to our authors! Although their model reproduces this sequence, they find that there is an age gradient across the sequence, rather than along it. In other words, galaxies in which star formation kicked off recently are not all found at one end of the sequence, ready to evolve along it, but generally live above it instead and will later fall below it. In this theory, galaxies evolve through the sequence, not along it (see Fig. 1).
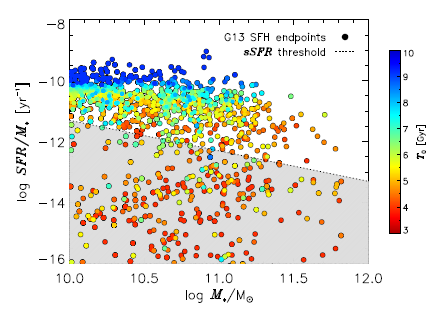
Figure 1: Colour-coding reflects how late star formation started (blue means later). There is a reasonably tight relationship between star formation rate and stellar mass for most galaxies (the ‘star formation main sequence’), but the colour-coding makes clear that galaxies principally evolve downwards, through the ‘sequence’, rather than along it (as in the traditional picture). The greyed-out region contains galaxies with star formation rates too low to detect, i.e. which have dropped off the sequence. (Fig. 9 from the paper)
Some galaxies appear to shut off star formation very quickly while others slowly burn out (e.g. as discussed here). This seems to indicate that perhaps star formation is ‘quenched’ in two different ways, though the details aren’t completely clear. Our authors beg to differ on this as well, showing that in their picture these observations are easily reproduced, without resorting to a special mechanism for switching off star formation abruptly in some galaxies (see Fig. 2).
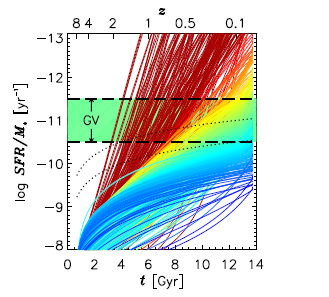
Figure 2: Part of Fig. 6 from the paper. Here the colour code gives the present-day star formation rate (blue means still forming lots of stars), while the tracks show the change in the star formation rate of individual galaxies over billions of years according the model. The fact that some galaxies move through the ‘green valley‘ (GV) region of low star formation quickly, while others move through it slowly, simply corresponds to the fact that some galaxies have extended star formation histories while others don’t. In other words, no special process is forcing some galaxies to quench their star formation swiftly.
So what does all this mean? This simple, physics-free model seems to reproduce our observations very well. The authors offer two possibilities:
1) The model is a good one, which means the shape they choose for the star formation history is telling us something important about the underlying physics: namely, that particular mechanisms that restrict or encourage star formation are not very important, with the initial conditions under which galaxies form being more important in deciding when a galaxy will form stars and for how long it will form them.
2) That if the model is not a good one, the data that we have is insufficient to prove that it isn’t any good … probably because of our reliance on snapshots of galaxy evolution, rather than being able to follow individual galaxies as they grow.
In either case, these results could require a major rethink of galaxy evolution. Only future, more detailed, observations will tell!
Author
Trackbacks/Pingbacks