Title: CHEOPS finds KELT-1b darker than expected in visible light: Discrepancy between the CHEOPS and TESS eclipse depths
Authors: H. Parviainen, T.G. Wilson, M. Lendl, D. Kitzmann, E. Pallé, L.M. Serrano, E. Meier Valdes et al.
First Author’s Institutions: Instituto de Astrofísica de Canarias & Universidad de La Laguna, Tenerife, Spain
Status: Published in Astronomy & Astrophysics (open access)
You might hope that the more you observe an object, the more you understand it, but with something as complicated as a brown dwarf that’s not always the case. With patchwork-like clouds and strong winds, the atmospheres of brown dwarfs can have significant variability, while irradiated brown dwarfs (those which orbit a star) get roasted by the stars they transit.
KELT-1b, for example, whips around its host star every 1.2 days, creating an environment similar to that of an “ultra-hot” exoplanet, and has a surface gravity over 20 times stronger than that of Jupiter. Being such an intriguing object, KELT-1b has been studied with a wealth of ground- and space-based telescopes across the optical and IR spectrum, obtaining multiple measurements of its day and night sides. While IR measurements of the brown dwarf have been seen to agree with each other, measurements made with TESS indicate that the brightness and the temperature of the dayside are much higher in the optical than anticipated. A high optical brightness could be because the albedo of the dayside is increased by the presence of reflective clouds. However, since the dayside is too hot for clouds to form, strong winds would be required to blow clouds from the cooler nightside into view for this explanation to be valid.
To test whether the optical is truly conflicting with the IR, the authors of today’s paper make use of new observations from the CHEOPS satellite.CHEOPS has an observing filter in the optical which is bluer overall but still partially overlaps with the TESS filter. If the cloud hypothesis is correct, then the CHEOPS results should be similar to those from TESS.
Modelling the Problem
With eight new eclipses of KELT-1b to hand, the authors combined all the previous observations of KELT-1b to produce a joint model of its phase curve. This method highlights the change in the total flux from the star and the planet combined as the tidally locked brown dwarf orbits its host star, presenting different faces to the observer, shown in Figure 1.
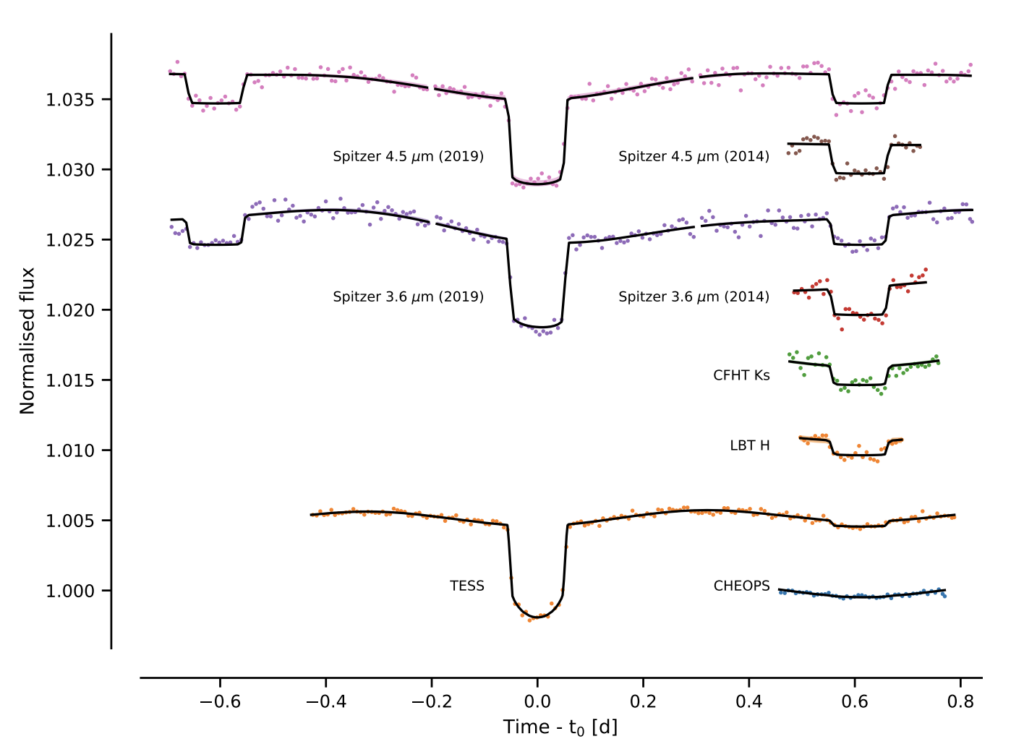
To accurately do this, it is important to include both the transit and eclipse as the brown dwarf passes directly in front and behind the star. Only then, the changing contributions of reflected and emitted light from the atmosphere can be fully captured. Since KELT-1b is much larger than a typical planetary companion, the authors also have to consider the impacts of the brown dwarf’s gravitational pull distorting the star into a less spherical shape (known as ellipsoidal variations), and any doppler shifting of light as the objects orbit a common centre of mass (known as doppler beaming).
Through this careful modelling, the authors obtained the eclipse depth, quantifying the drop in flux when KELT-1b passes behind the star and is no longer contributing to the total flux observed. While the eclipse depths for all previous observations are as expected, the value obtained from CHEOPS is much smaller than that of TESS. This is clearly visible in Figure 1 as the almost indistinguishable change in flux around the phase time of 0.6 for the blue CHEOPS points compared to the orange TESS points. The authors also used the phase curve models to estimate the dayside temperature from each dataset. While the dayside temperatures for the previous observations generally agree, the CHEOPS estimate is much lower, as expected given the difference in eclipse depths.
Reflecting on the Differences
To understand what might be causing these differences, the atmosphere of KELT-1b was modelled using the six eclipse depths across the optical and IR spectrum. As seen in Figure 2, the model can explain most of the eclipse depths as estimated from the phase curves (shown by the orange areas). However, the CHEOPS and one Spitzer measurement are poorer matches to the model predictions (shown by the black data points).
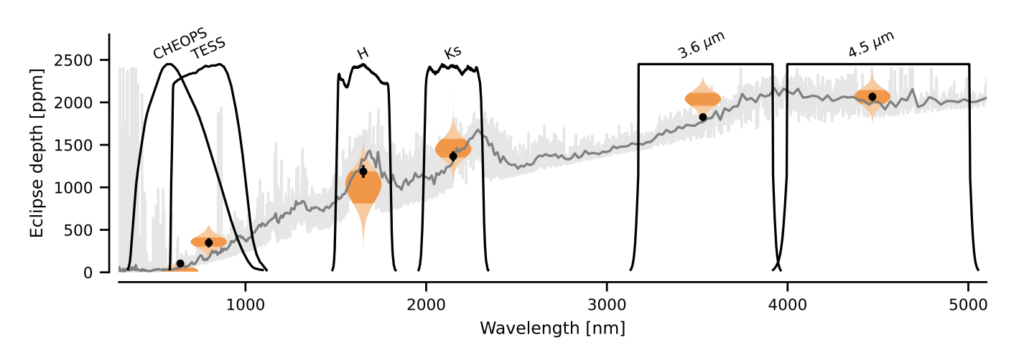
Although the Spitzer discrepancy could be explained by the impacts of disequilibrium chemistry processes not included in the model, the tension caused by the poorly fit CHEOPS depth and the better fit TESS depth is harder to explain. The atmospheric model determined that KELT-1b is best fit by an albedo of 0.3 in the TESS band, but by an albedo of 0 in the CHEOPS band. This is puzzling as the two bands have substantial overlap. So why might the atmosphere not be similarly reflective at similar wavelengths? If patchy clouds are forming on the nightside of KELT-1b and being blown to the dayside, it is possible that the albedo of the dayside has changed between the CHEOPS and TESS observations, which took place roughly 1 year apart. If the difference in cloud cover is significant enough, then this might explain the curious case of KELT-1b.
Astrobite edited by Konstantin Gerbig
Featured image credit: NASA/JPL-Caltech/R. Hurt (SSC)