Authors: Joel Cortez Osuna, Sarah Shandera
First Author’s Institution: Department of Physics and Institute for Gravitation and the Cosmos, The Pennsylvania State University, University Park, PA 16802, USA
Status: preprint available on arXiv
What is microlensing, and what is it good for?
When Einstein came up with his theory of General Relativity, he predicted that space could be curved by large masses, and that light travelling past a large mass on the way to our telescopes could be bent (or lensed) by this curvature: this is what we call gravitational lensing.
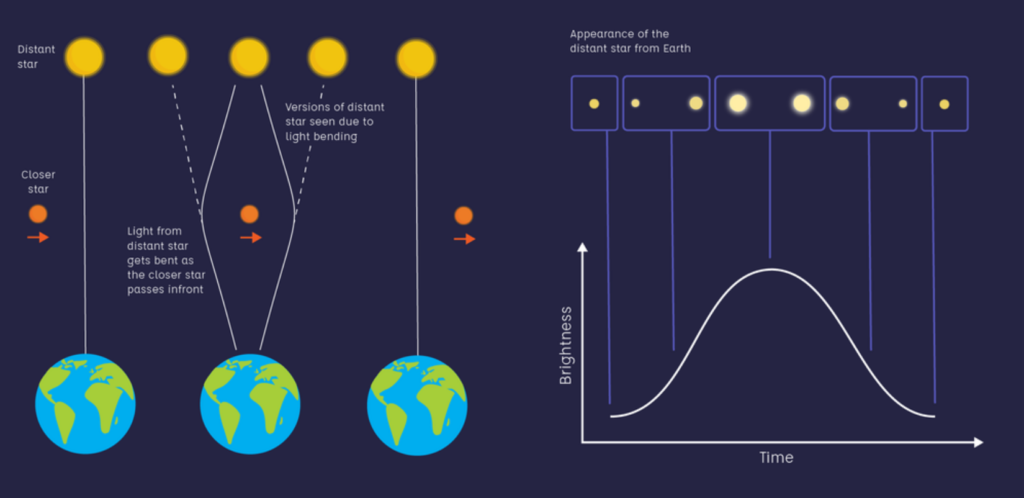
We often hear about gravitational lensing in the context of a massive foreground galaxy or cluster lensing other far away galaxies (e.g., see this or that astrobite). In today’s astrobite, we are particularly interested in another useful type of gravitational lensing called microlensing, which happens on much smaller scales, within our own galaxy! Microlensing occurs when a foreground massive object (like a black hole) passes in front of a background luminous object (like a star), and temporarily lenses it, leading to a measurable change in the brightness of the star over the time of the transit. Its brightness increases because the lensing creates two apparent images of the source star and also makes them look bigger, as illustrated in Figure 1.
Microlensing is very useful to learn about objects which emit very little to no light, but which are detectable through their gravity bending light from background stars. In fact, it has been successfully used in the past to detect exoplanets (also see this and that astrobite), and measure dark matter in distant galaxies. In this paper, microlensing is used to look for dark compact objects…
What are dark compact objects?
Many common dark matter (DM) models postulate that it is composed of only one type of particle, which only interacts with normal matter through gravity.
Some alternate models of DM, however, predict that DM could actually be made up of so-called ‘dark compact objects’ (DCOs). For context, ordinary compact objects — made up of ordinary matter — are a class of very dense objects including black holes, neutron stars and white dwarfs, which all form after the core of a star collapses into a very small volume at the end of its life.
In the realm of DCO theories, a popular one is that DM could be made up of a lot of very tiny primordial black holes (PHBs) which formed from the direct collapse of small very dense regions in the first few moments after the Big Bang.
In contrast, other DCO theories suggest that instead of being made up of one type of particle, DM could be made up of a whole collection of particles — think of it like, e.g., ‘dark protons’, ‘dark electrons’, etc. — which can interact with each other. These interactions would allow the DM to cool down and collapse into objects like dark black holes (DBHs), dark neutron stars, or dark white dwarfs, which would form at much later times than PBHs.
So how can we tell which DCO is DM, if any? Since DCOs don’t emit light but still have mass, microlensing is an ideal way to try to detect them: some PBH evidence has already tentatively been found using microlensing! Given that PBHs and DBHs were formed at very different times, and through very different mechanisms, they are expected to have different properties, and the authors of today’s paper try to establish whether it would be possible to distinguish between PBHs and DBHs in microlensing data.
Parameters of a (micro)lensing prescription
In practice, microlensing surveys keep track of different things: the change in the source star’s brightness as a function of time — called a light curve —, changes in the shape of this light curve depending on the location you are observing it from — called parallax —, and little wobbles of the source star’s position. From these observations, astronomers usually extract three main microlensing parameters:
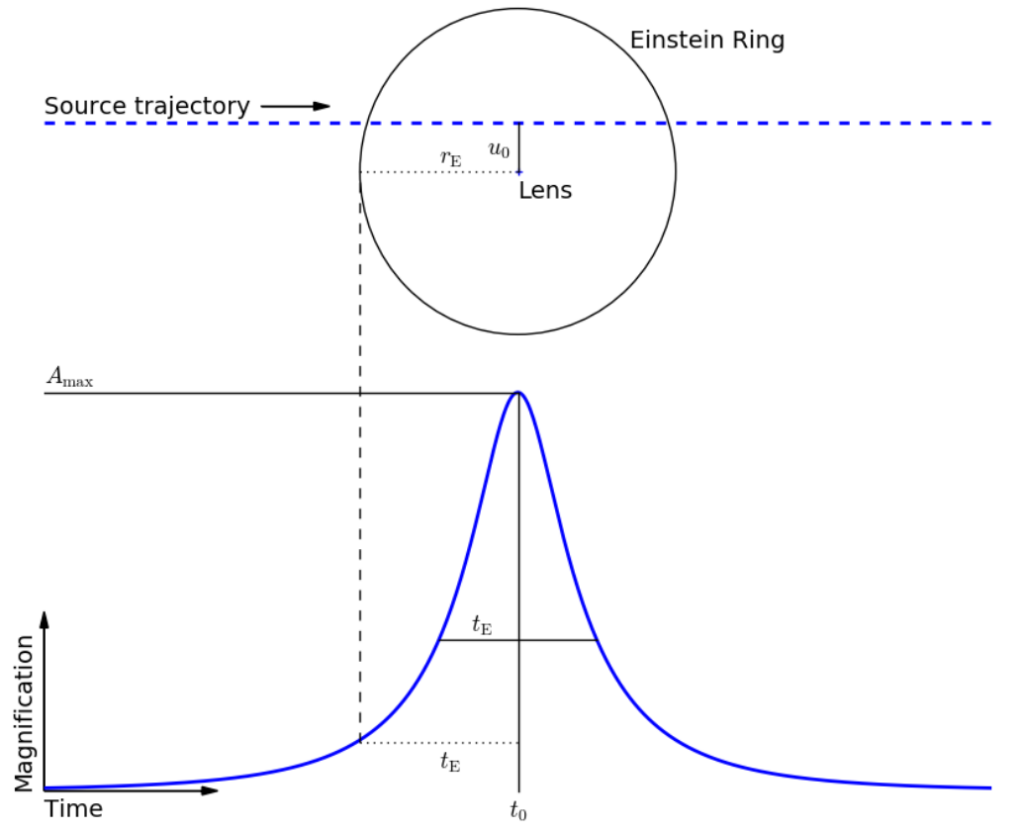
- The angular Einstein radius (θE): This is the angular radius of the ring of light, called the Einstein ring, appearing around the lens when the source star is perfectly behind the lens object from the observer’s perspective. See Figure 2.
- The Einstein crossing time (tE): The time it takes the source star to travel a distance of one Einstein radius. See Figure 2.
- The microlensing parallax (πE): Quantifies how much the light curve deviates from symmetry due to the Earth’s motion around the Sun.
From these three different microlensing observables, we can infer the lens object’s mass, its distance, and its velocity!
Reversing the process with modelling
In this paper, the authors sort of “invert” this process. First, they come up with models for the mass, distance and velocity distributions of PBHs and DBHs, from which they then compute the corresponding microlensing parameters (tE, θE, πE). The PBH and DBH models differ in two major ways:
- Their spatial distribution in the Milky Way: PBHs would be found throughout the Milky Way’s DM halo, while DBHs would mostly be concentrated in the center of the Galaxy, within the stellar bulge.
- Their mass distribution: DBHs are formed through channels very similar to ordinary compact objects, which gives them a similar mass distribution shape, while PBH masses depend on early Universe physics.
The three distributions are sampled many times for both PBHs and DBHs to get a good statistical representation of the values of microlensing observables that could be observed for each population.
A whole lotta overlap
Figure 3 summarizes the main results of the paper. It shows which regions of the microlensing parameter space are occupied by each DCO population. First off, it seems like there is a lot of overlap between DBHs and PBHs. However, there are a few smaller regions in each plot where the purple and orange separate out a bit, resulting mostly from their different spatial distributions in the Milky Way.
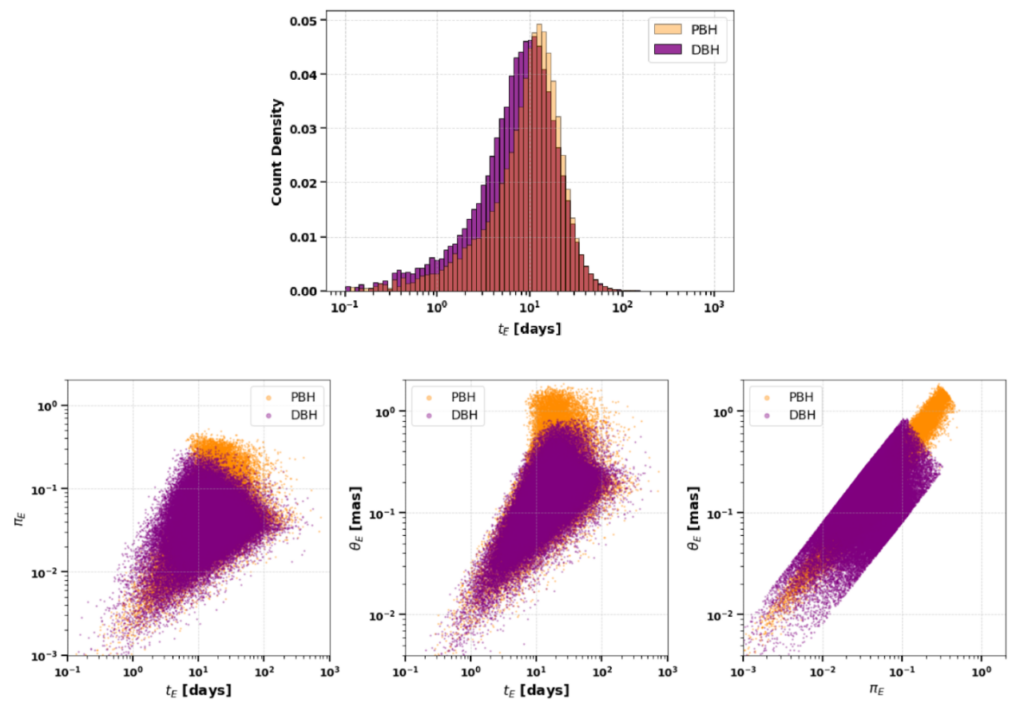
What’s important to take away from Figure 3, is that the PBH and DBH are not very distinguishable from their tE values alone (as seen from the close resemblance of the two histograms in the top plot), but they start to have regions of clean separation when you consider tE alongside θE and πE. This suggests that astrometric microlensing measurements such as those made to obtain θE and πE will be really essential to distinguish PBHs from DBHs in upcoming microlensing data.
Dark or not dark?
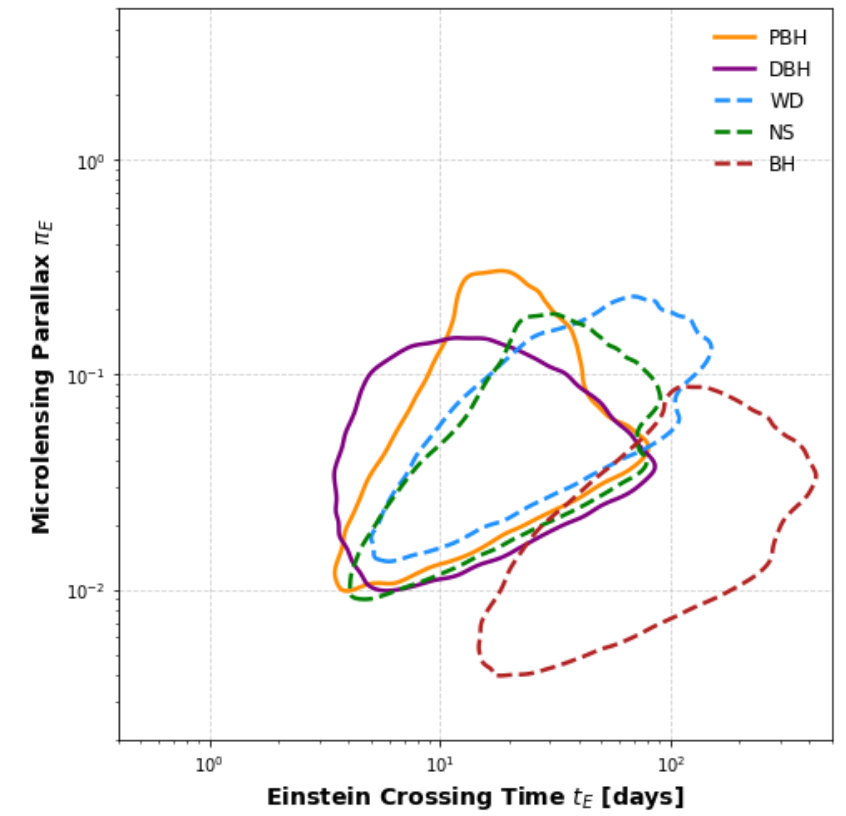
The authors also investigate if they could easily distinguish DCOs from ordinary compact objects with microlensing. They similarly find that there is significant overlap between DCOs (PBH and DBH), and neutron stars and white dwarfs, but as before there are some regions of distinction, as seen in Figure 4.
The final takeaway from this paper is that if we want to be able to distinguish between all these different types of compact objects with microlensing, we will need to observe a lot of microlensing events to fill out the parameter space, and tell these populations apart by the regions of parameter space they occupy. Thankfully, upcoming surveys such as the Rubin Observatory’s Legacy Survey of Space and Time (LSST) forecast that they will detect around 1000 microlensing events per year; taking a big bite into the parameter space!
Astrobite edited by Jayde Willingham
Featured image credit: Original image by ESA/Hubble & NASA, S. Jha. Modified with blur and eyeglass cartoon by Laurie Amen.