Authors: Laura Kreidberg, Michael R. Line, Jacob L. Bean et al.
First Author’s Institution: University of Chicago
Although over 4,000 planet candidates have been discovered, only a handful of those candidates are eligible for atmospheric characterization with current ground and space based telescopes. Namely, in order to confirm a planet’s existence, you just need to detect the shadow of a planet as it moves in front of a star by measuring the brightness of the star (called photometry). Atmospheric characterization (through transmission spectroscopy) relies on the idea that as the planet passes in front of the disk of its parent star, some photons from the star must pass through the thin atmosphere of the planet. Depending on what gases lie in the planetary atmosphere, some photons will either be absorbed or transmitted. The photons you collect, then get spread out over wavelength to produce a spectrum. Therefore you need many more photons, or much a higher signal than from the photometric signal obtained during planet detection. Because of this, when a planet’s transit produces a high enough signal so that it can be observed through transmission spectroscopy, it is usually beaten to death via the following process:
- Party A makes a claim about X
- Party B makes a different observation and infers something else about X
- Party C can now make their own observation and either support A, support B or make yet another claim about X
- And so on…
One example of this is exoplanet GJ 1214 b, which was observed here and here and here and here. That is not to say that this is a wasted effort. It is not. Today’s bite beautifully demonstrates why the process outlined above is so desperately needed by discussing what lies within the atmosphere of exoplanet WASP-12b.
WASP-12b is one of the best-studied hot Jupiter exoplanets due to its large size (1.8 x Jupiter’s radius) and small orbital period (just 1.1 days!). There have been at least 17 parties that have made claims about what combination of gases lies within its planetary atmosphere. More specifically, the claims have largely been centered on whether or not the planet has a Carbon to Oxygen (C/O) ratio greater or less than 1. As you might think, C/O ratios tell you the amount of atmospheric carbon relative to oxygen. Meaning, does the planet have an abundance of oxygen-rich species (i.e. water vapor), or carbon-rich species (i.e. methane). A previous bite outlines how C/O ratios could tell us about the evolution and formation of a planet. It has also been suggested that we could classify hot Jupiters by what their C/O ratios are. The saga continues as Kreidberg et al. attempt to reveal the mystery of the WASP 12b C/O ratio.
Observations with the Hubble Space Telescope
When observing exoplanetary atmospheres via spectroscopy you want to make sure you have a large wavelength coverage, very good knowledge of the host star’s variability, and as many transits as possible (more info here). Kreidberg et al. used the Hubble Space Telescope‘s (HST) instrument Wide Field Camera 3 (WFC3) to get six transits (previous HST observations only had 1) in the wavelength region 0.82-1.65 microns (previous HST observations only covered from 1.12-1.65 microns). Furthermore, they obtained 428 images of the host star over a three-year period, which gave them an excellent idea of how the star was varying over time. These observations result in a transit light curve, shown below.
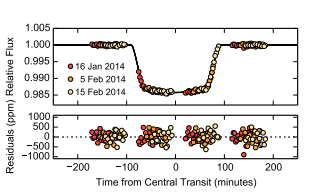
Top image shows the transit light curve of the WASP 12-system. Different colors signify the date of observation. The bottom image shows the observations minus the light curve model. Residuals show that the model and the light curve are in good agreement.
Now what?
Once you have the data, the process of actually inferring what is in the planetary atmosphere is a completely different ball game. The process of inferring from you data is usually referred to as retrieval. Planetary atmospheric retrieval is a relatively young field but we have been retrieving atmospheric signals from stars for years. Nevertheless, as this bite on stellar models points out, there is often disagreement among the models needed for atmospheric retrieval. And if there is disagreement in the well-developed stellar atmosphere codes, you better believe there is going to be disagreement between the planetary atmosphere codes which are less evolved. Therefore, to boost the credibility of their retrieval, Kreidberg et al. used several different techniques to retrieve their atmospheric signal.
What do we learn?
By implementing and comparing several retrieval techniques, the authors were able to deduce (for the first time ever!) that water is present in the atmosphere of WASP-12b. Even though this planet has been observed roughly 17 times, this was the first unambiguous spectroscopic detection of a molecule, which speaks to how our observational techniques and models of planetary atmosphere are improving and evolving. You can see in the transmission spectrum below, that the water band feature at 1.4 micron is very clear and the error bars are well below the signal of the feature. Due to the strength of their signal, Kreidberg et al. were also able to constrain the water abundance to a volume mixing ratio of 10-5-10-2, allowing them to speak to the infamous C/O ratio. Broadly speaking, high water abundances lead to low C/O ratios. So there is no surprise that their C/O ratio is calculated to be approximately 0.5 (i.e. less than one).
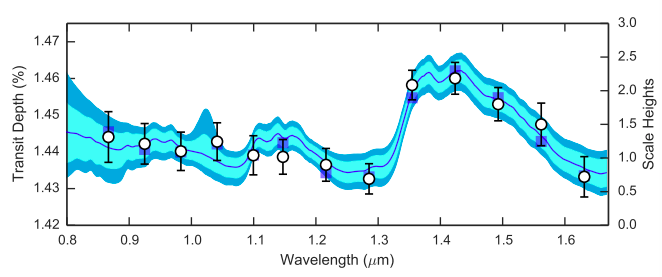
Here the points are the extracted transmission spectrum of the WASP-12b measured with HST. The blue squares are the best fit model and the shaded regions are 1 and 2 sigma credible intervals. The increase in signal at 1.4 micron is the detected water band.
Who is right?
The authors of this paper point out that their result is in tension with previous studies. Previous studies have also analyzed WASP-12b with high precision data and state-of-the-art models. So where does that leave us? Is one group wrong and another right? The answer to this is not as black and white as you might think. Planetary atmospheres are highly complex, and so confining an entire atmosphere into one number (C/O) might not be very informative. The authors (and everyone else) point out that their retrieval techniques assumes the planet is 1-dimensional (no variations in latitude or longitude). Thinking about it in terms of Earth. Imagine if you tried to claim Antarctica and Brazil could be described by the same temperature profile! One way of alleviating the issue of 1-D models is to observe the planet in several different geometrical alignments so that we could gain an intuition for the variations across the planet’s atmosphere.
All in all, Kreidberg et al. have done a great job outlining what lessons we can learn from this example… If you want to really understand what is going on in a planetary atmosphere you must:
- Observe the planet from as many different angles as possible (i.e. observe the planet when it is passing right in front of the star, right before it is passing behind the star, etc.).
- Get the highest precision observations possible, in order to resolve atmospheric features well
- Use several different atmospheric retrieval techniques to make sure your answers are not model dependent
Sounds pretty easy, huh? Hah! Looks like exoplanet observers have a lot of work to do.
Author
WOW!! This is really cool!!!! Great post!
I’m glad I’ve taken a basic astronomy class to better understand this, but I don’t think I would’ve needed it since everything was explained so well. Very interesting!
I love these sagas because they’re a great demonstration of the scientific method in action. Diverging hypotheses resolved with new data.
Oh great! It was a good thing that I got my photochemistry paper on WASP-12b with high C/O ratio 3 years ago!