Title: The NANOGrav 15-year Data Set: Evidence for a Gravitational-Wave Background
Authors: The NANOGrav Collaboration
Status: Published in The Astrophysical Journal Letters, open access
Disclaimer: The authors of this Bite are members of the NANOGrav Collaboration. Nearly 200 scientists at NANOGrav, alongside colleagues in other pulsar timing arrays across the globe, have been working towards these results for decades. Seven additional papers were written in conjunction with the search for a gravitational wave background paper and are filled with more amazing science. This Bite just scratches the surface of the implications of this result.
Gravitational waves have become an increasingly essential part of astrophysics research. They were first indirectly measured by their effect on the orbital period of the famous Hulse-Taylor binary pulsar in the 1970s. Forty years later, the Laser Interferometer Gravitational-Wave Observatory (LIGO) and Virgo collaboration directly detected a gravitational wave signal from the final fraction of a second before two stellar-mass black holes merged. Since then, ground-based interferometers (including LIGO, Virgo, and KAGRA—known as LVK) have cataloged dozens of these events, ushering in the exciting field of gravitational wave astronomy.
While LVK’s detections can tell us a lot about stellar-mass black hole populations, they are limited to gravitational waves within a particular wavelength band. This is akin to observing the cosmos in visible light without access to the infrared, microwave, X-ray, and so on. To gain access to gravitational waves at lower frequencies, collaborations around the world have turned to pulsar timing arrays (PTAs).
A PTA is a galaxy-sized gravitational wave detector formed from a collection of pulsars. As a gravitational wave passes between Earth and the array of pulsars, spacetime is stretched and squeezed. This causes the otherwise very regular pulses from the pulsars to be delayed or advanced, allowing astronomers to infer the passage of a gravitational wave. Today, the North American Nanohertz Observatory for Gravitational Waves (NANOGrav), alongside other PTAs around the world, has announced that this method has produced strong evidence for the existence of a background of low-frequency gravitational waves, further expanding the frontier of gravitational wave astronomy.
The NANOGrav 15-year data set
PTAs require patience—and lots of it. Nanohertz-frequency gravitational waves will appear in the detector in two forms: as an individual source such as a supermassive black hole binary (SMBHB), or as a stochastic (statistically random) background, the sum of all gravitational wave signals in the Universe from various sources. These waves have periods on the order of years to decades; therefore, searching for them requires observing pulsars over similarly long timescales. NANOGrav’s newest data set contains 15 years of observations. To put that in perspective, some of the PhD students in the collaboration were in kindergarten when those first data points were taken.
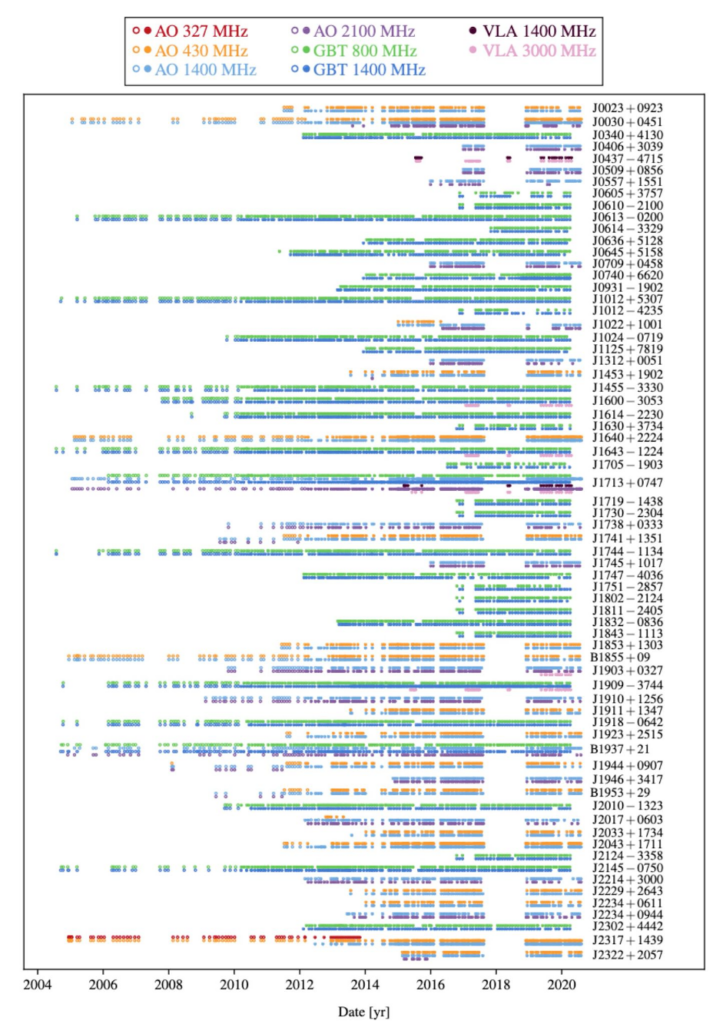
NANOGrav currently monitors over 80 pulsars that rotate over 100 times per second, called millisecond pulsars (MSPs); 68 are featured in its 15-year data set. They comprise a wonderful zoo of quirky characters. There’s the precise but mischievous J1713+0747, the extremely massive J0740+6620, the first MSP ever discovered B1937+21 — and a host of others.
Observing these pulsars regularly — once every 3–4 weeks for most — requires several telescopes. The latest data set features observations from the Green Bank Telescope (GBT), the Arecibo Observatory, and the Very Large Array (VLA). This allows the collaboration to monitor pulsars more often across a larger portion of the sky.
Getting down with Hellings and Downs
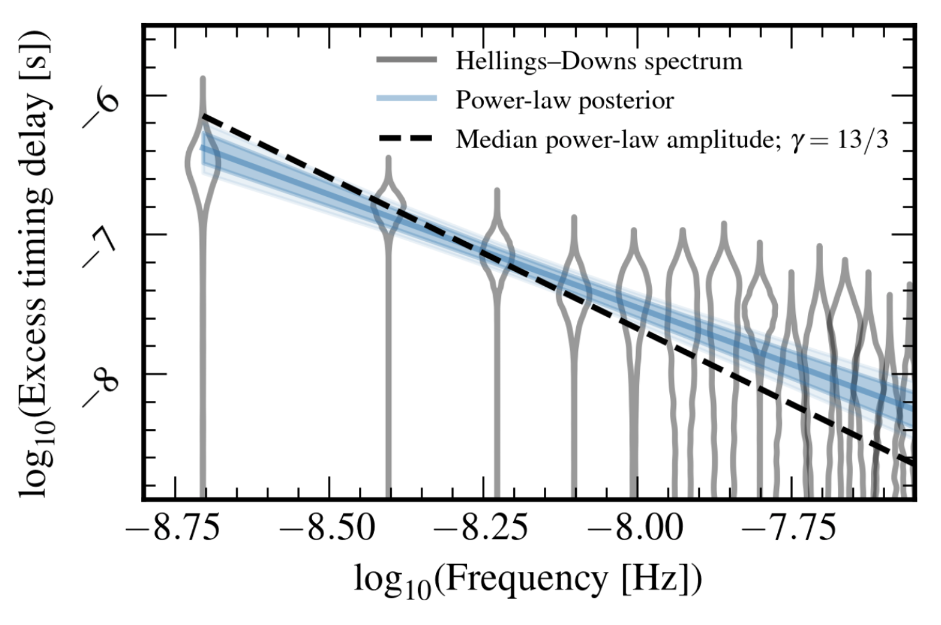
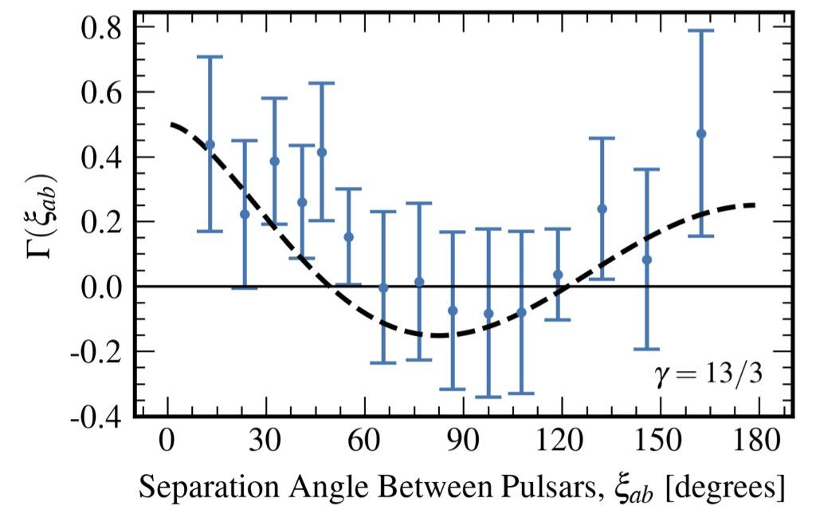
A gravitational wave background will cause deviations in the arrival times of pulses owing to the changing distance between the Earth and the pulsars. Taking the power spectrum of the timing deviations gives the amplitude of the background at each frequency, but other sources of noise could also contaminate this signal. However, the pulse delays between two pulsars should be correlated according to their angular separation in the sky. This relationship is called the Hellings and Downs correlation. No known noise process can mimic this pattern, which is why these telltale correlations have long been the holy grail of pulsar timing. NANOGrav’s previous data set exhibited a power-law power spectrum, as expected from a simple gravitational wave background model. However, there was little evidence of the Hellings and Downs correlations.
In the 15-year data set, NANOGrav again observes the power-law power spectrum (Figure 2). But this time, they also find strong evidence for the Hellings and Downs curve (Figure 3), indicating strong evidence for the existence of a nanohertz-frequency stochastic gravitational wave background. The added observation time and additional pulsars in the array allow PTAs to be more sensitive to gravitational waves and find evidence for the Hellings and Downs correlation for the first time. This achievement opens a brand-new observational band for astrophysicists to observe. For the first time, we hear the bass notes of the cosmos’ gravitational wave symphony.
New or Classical Physics?
We now have incredible evidence for a gravitational wave background, but what is creating it? There are many theoretical sources, so NANOGrav rigorously analyzed their data to see which models are supported.
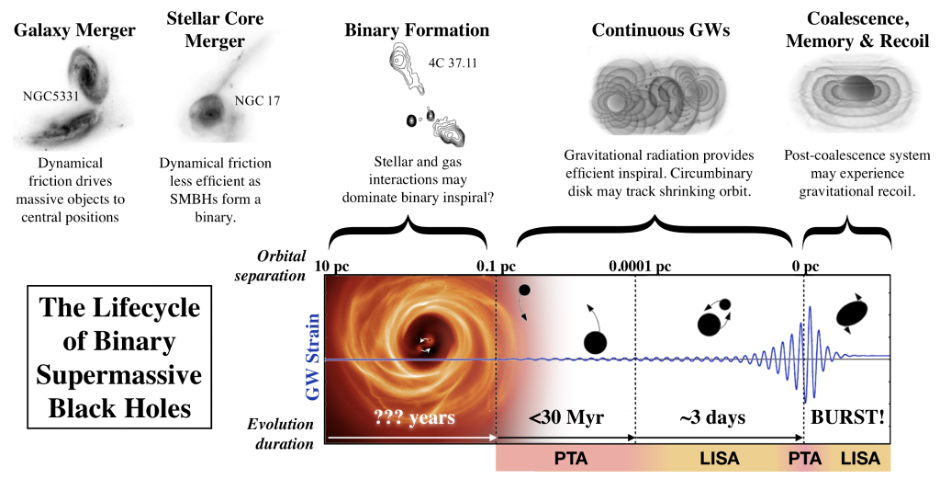
A primary candidate source of the GWB is a population of supermassive black hole binaries (SMBHBs). They emit nanohertz gravitational waves as they orbit each other, causing them to inspiral; however, this emission isn’t enough to cause them to merge within the age of the universe (see the ‘final-parsec problem’). But we observe mostly individual black holes in galaxy centers, so there must be other processes that drive SMBHBs to merge, such as interactions with the surrounding gas disk or with other stars around the black holes. By comparing simulations of SMBHBs interacting with their environments and emitting gravitational waves with PTA data, we can learn how SMBHBs form and how galaxies evolve. NANOGrav found that these simulations could recreate the background signal in the 15-year data set, but further work is required to definitively constrain astrophysical parameters and models.
NANOGrav also searched for individual SMBHBs. A relatively-close SMBHB will create a signal that appears louder than the background at a specific frequency, which could be detected and compared with an SMBHB candidate from electromagnetic observations. The resulting multi-messenger observations would teach us a lot about the Universe’s SMBHB population by, for example, constraining galaxy/black hole mass relations and further understanding accretion processes. While there is no evidence for any individual binaries in the data set, NANOGrav determined that no individual SMBHB with a chirp mass of \(10^9 M_\cdot\) (a billion solar masses) can be detected further than order 10 megaparsecs away from the Earth.
A different explanation for the signal is ‘beyond the Standard Model’ (BSM) physics. These theoretical models introduce new physics to attempt to unify the Standard Model and general relativity into one grand ‘theory of everything’. Different phenomena predicted by these theories could produce nanohertz gravitational waves, including cosmic strings, first-order phase transitions, and relic gravitational waves from the early universe. NANOGrav found that the background signal could also be explained by some of these models, as well as from a combination of an SMBHB and a BSM model.
Further analysis and data collection are required to discriminate between these sources by measuring how isotropic the signal is. A BSM model would create an isotropic background with equal power in all directions, but an astrophysical background would appear anisotropic because of a discrete number of SMBHBs in the Universe. NANOGrav found no significant evidence for or against anisotropy yet.
A New Era in Gravitational Wave Astronomy
For the first time, we have statistically strong evidence for the long-awaited Hellings and Downs correlations predicted for a stochastic gravitational wave background. However, there is still a lot to learn. Fortunately, NANOGrav is far from alone in the quest to detect low-frequency gravitational waves – and in finding evidence of their existence.
Four other PTA collaborations announced their latest data sets today: the Parkes Pulsar Timing Array (PPTA); the European Pulsar Timing Array (EPTA, which also includes some data from the Indian Pulsar Timing Array, InPTA); and the Chinese Pulsar Timing Array (CPTA). Like NANOGrav, they all find varying degrees of evidence for a stochastic gravitational wave background. The fact that all of these PTAs, which use different telescopes, pulsars, and analysis techniques, come to similar conclusions indicates something exciting: we’re only just beginning to explore this new era in gravitational wave astronomy.
Author list: Lucas Brown, Graham Doskoch, William Lamb, Phia Morton, Brent Shapiro-Albert, Haley Wahl
Editor list: Jenny Calahan, Huei Sears, Briley Lewis
Cover image: Olena Shmahalo/NANOGrav
Edit: links to papers added when they were made available!